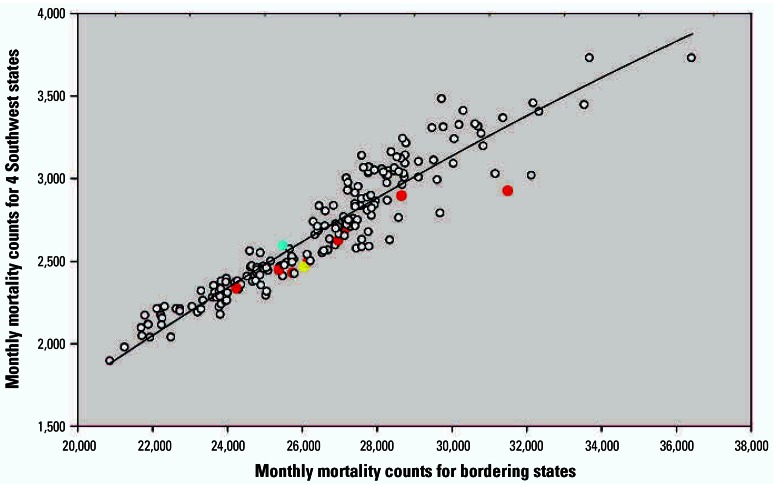
Figure 4.
Monthly mortality counts for the four Southwest states plotted over monthly mortality counts for bordering states. The blue dot indicates the month when strike began mid-month (July 1967). Red dots indicate full strike months (August 1967–March 1968). Yellow dot indicates first end-of-strike month (April 1968). The line is a quadratic regression line fit through the data.

