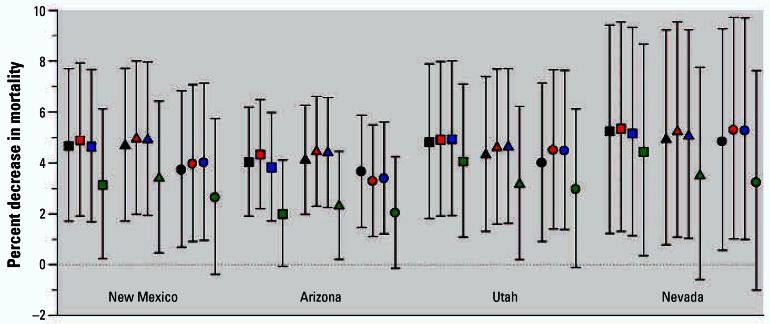
Figure 6.
State-specific estimated decreases in mortality (and 95% CIs) associated with August 1967–April 1968 strike indicator period using alternative models. Black, red, blue, and green symbols indicate the inclusion of total mortality counts from all other U.S. states, eastern U.S. states, neighboring states, or bordering states, respectively. Squares, triangles, and circles indicate models that additionally included none, just influenza/pneumonia, or all six nationwide cause-of-death variables, respectively.

