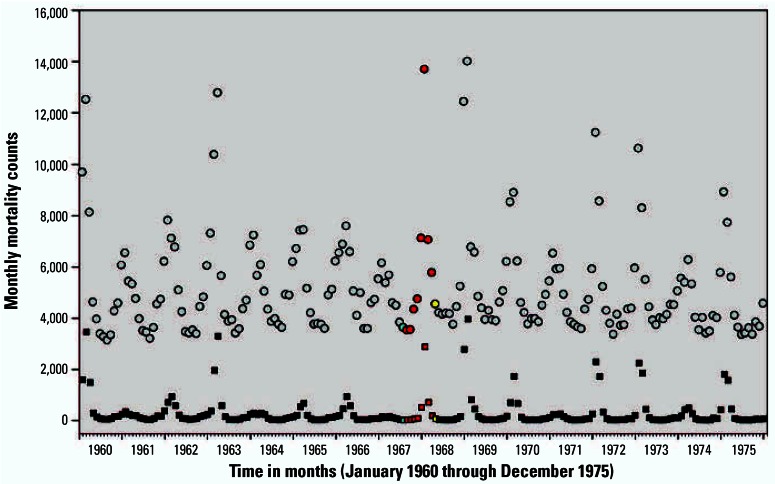
Figure 7.
Monthly mortality counts for influenza (squares) and influenza/pneumonia (circles) in the United States plotted over time. Blue indicates the month when strike began mid-month (July 1967). Red indicates full strike months (August 1967–March 1968). Yellow indicates first end-of-strike month (April 1968).

