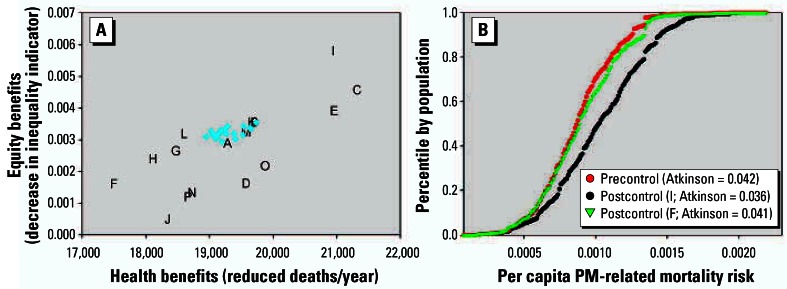
Figure 2.
Annual mortality benefits and change in risk inequality for power plant control scenarios (A), along with distribution of risk for baseline conditions and selected control scenarios (B) (indicator = Atkinson index, ɛ = 0.75; pollutants = SO2, NO2, PM2.5; baseline = PM-related mortality). Blue dots in A represent intermediate control scenarios, and letters represent defined scenarios listed in Table 1.

