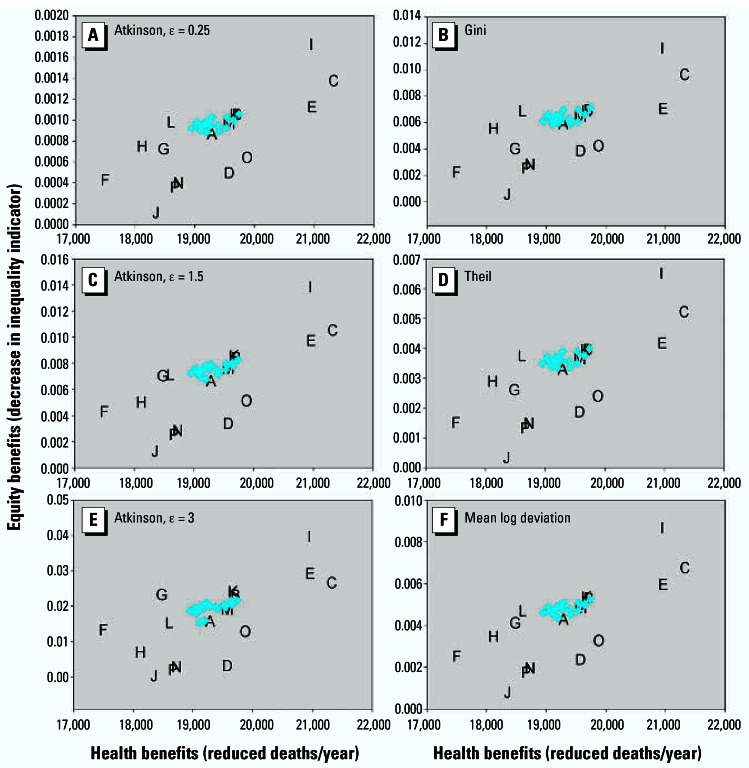
Figure 4.
Sensitivity of efficiency–equality tradeoff conclusions to choice of inequality indicator, with model otherwise specified as in Figure 2. Inequality indicators: (A) Atkinson index, ɛ = 0.25; (B) Gini coefficient; (C) Atkinson, ɛ = 1.5; (D) Theil entropy index; (E) Atkinson, ɛ = 3; (F) mean log deviation.

