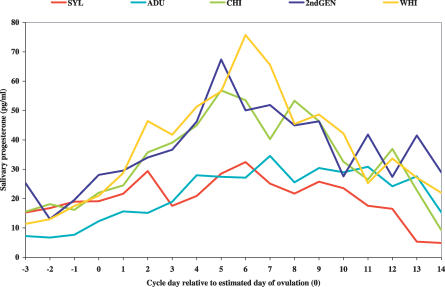
Figure 1. Average Luteal Progesterone Profiles by Group.
Unadjusted mean luteal progesterone index values. Mean ± SEM: 22.2 ± 3.1 pg/ml (resident Bangladeshi sedentees from Sylhet [SYL], n = 39); 24.6 ± 2.5 pg/ml (adult migrants [ADU], n = 46); 38.9 ± 5.7 pg/ml (child migrants [CHI], n = 39); 40.2 ± 5.5 pg/ml (second-generation British-Bangladeshis [2ndGEN], n = 29); 45.1 ± 4.3 pg/ml (British women of European descent [WHI], n = 45). Sample sizes include only the cycles for which an oestradiol midcycle peak and luteal progesterone rise were discernable (81%, 82%, 93%, 88%, and 94% of the original sample for SYL, ADU, CHI, 2ndGEN, and WHI groups, respectively). Oestradiol values were obtained from data available for the same individual menstrual cycles. Ovulation dates were estimated from individual oestradiol data [22]. Confidence intervals are omitted for visual clarity. Sample sizes include all women for which hormonal data were available and may differ from total sample sizes for other aspects of data collection.

