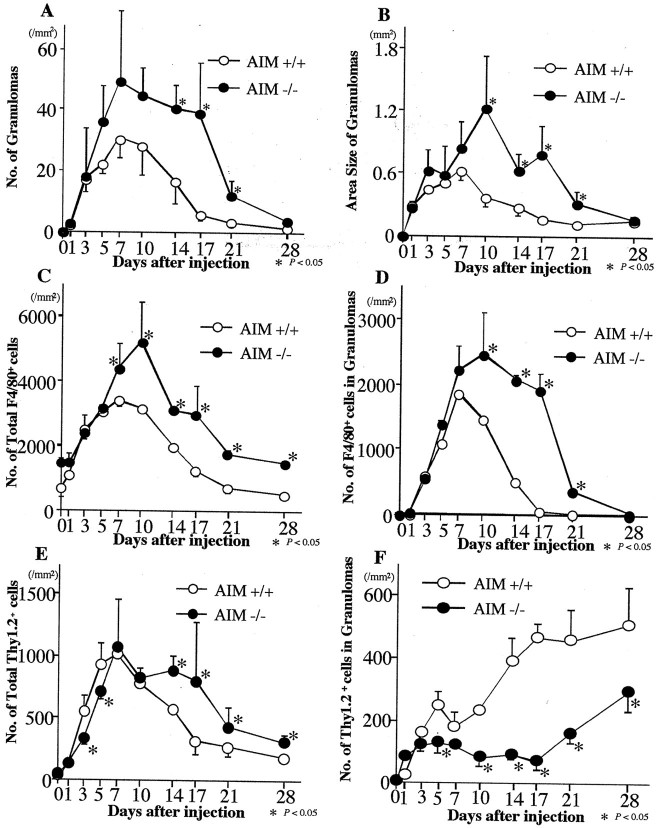
Figure 2.
The number (A) and area size (B) of granulomas in livers, the numbers of macrophages in the liver (C) and in the granulomas (D), and the numbers of Thy 1.2+ T cells in the liver (E) and in the granulomas (F) of AIM−/− and AIM+/+ mice after C. parvum injection. A and B: AIM−/− mice develop larger numbers of granulomas than AIM+/+ mice. C and D: Larger numbers of macrophages were present in the liver and granulomas in AIM−/− mice than AIM+/+ mice. E and F: The numbers of T cells had not remarkable difference in the liver, but there were smaller numbers of T cells in the granulomas of AIM−/− than in AIM+/+ mice. Data are shown as the mean ± SD of five mice. *, P < 0.05.

