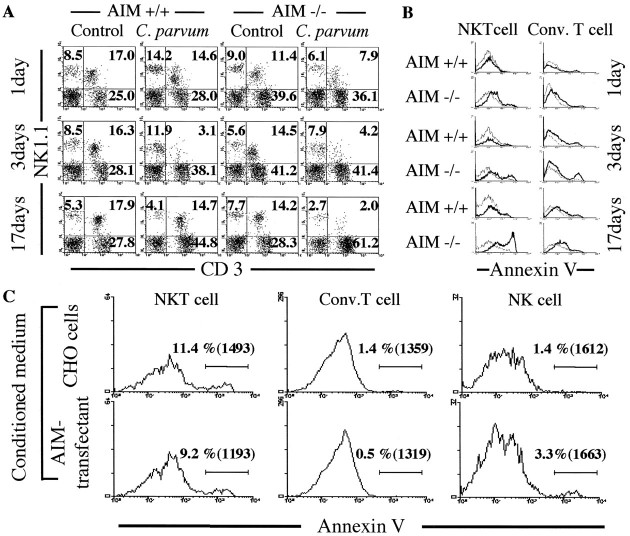
Figure 7.
Phenotypic characterization of T cell in the liver of AIM−/− and AIM+/+ mice by flow cytometric analysis for CD3 and NK1.1 (A) and for CD3, NK1.1, and Annexin V expression (B) at 1, 3, and 17 days after C. parvum injection. Surface phenotype analysis of cultured cells; liver MNCs (1 × 10⁷ cells per well) were cultured in 24-well microculture plates with (lower) or without (upper) rAIM protein for 24 hours (C). A: Proportion of NKT cells were decreased in both mice after C. parvum injection. However, repopulation of NKT cells was not observed in the knockout mice at 17 days. Numbers indicate the percentage of fluorescence-positive cells in the corresponding squares. The right upper gates exhibit the population of NKT cells, and the right lower gates show these of conventional T cells. Typical results from two experiments are shown. B: Apoptotic elimination of hepatic NKT cells and conventional T cells in the liver of AIM−/− was more remarkable than that of AIM+/+ mice, especially at 1 day and 17 days after C. parvum injection. Annexin V-positive NKT cells and conventional T cells in the liver of both mice after C. parvum injection are represented by bold histograms, and Annexin V-positive NKT cells and conventional T cells in the liver of each untreated mice are represented by thin histograms. Annexin V-positive cells are induced apoptosis. C: Cultured NKT cells with rAIM protein were more diminished in the number and proportion of apoptotic cells, and a few conventional T cells, but not NK cells. Percentages of labeled cells with Annexin V are shown in the histogram. Mean fluorescence intensities are shown in the brackets.

