
Figure 8.
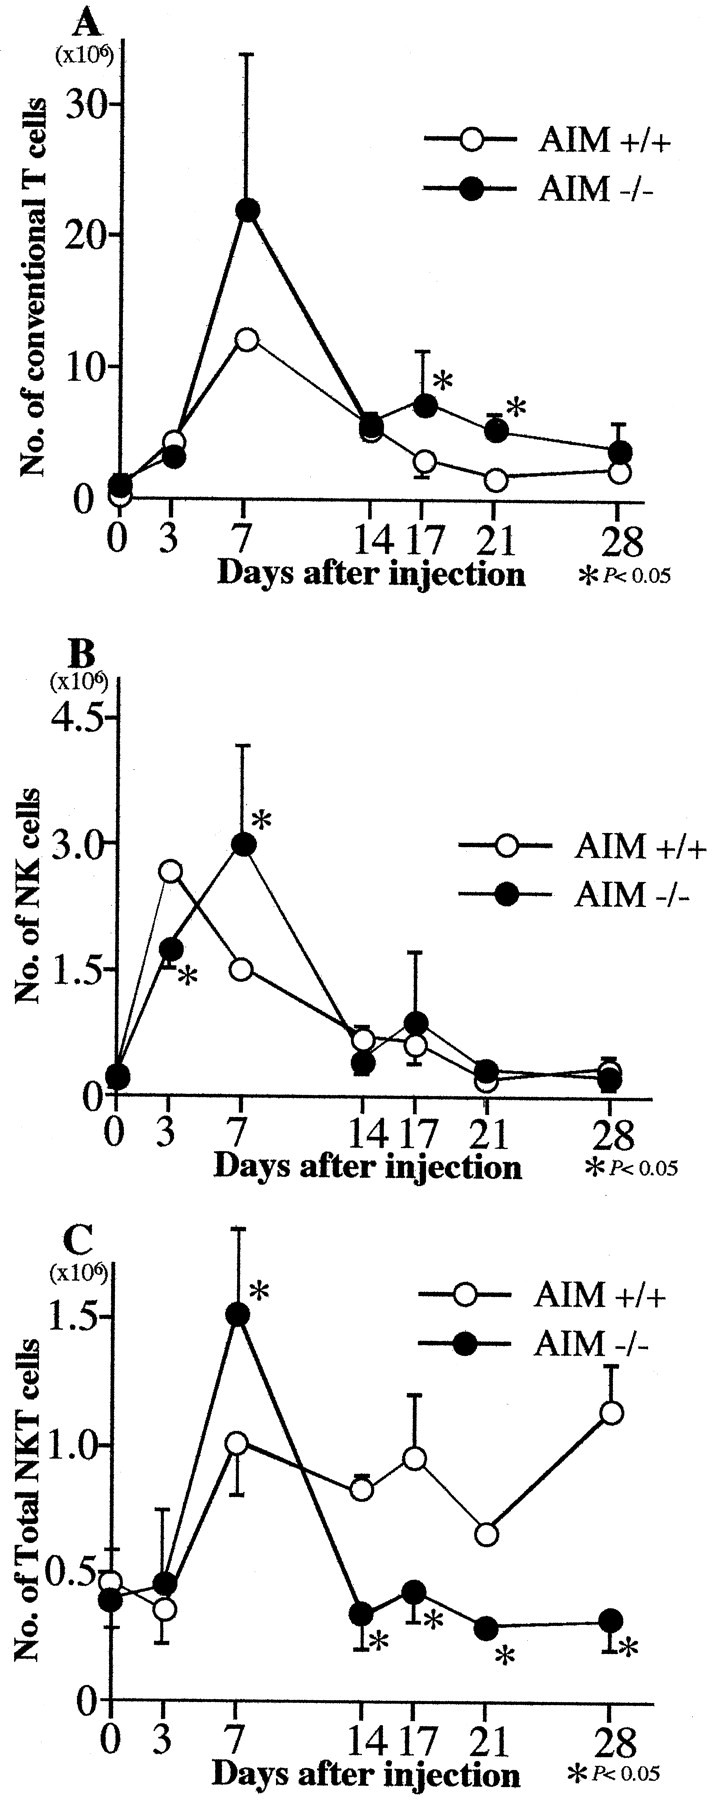
The absolute cell numbers of conventional T cells (A), NK cells (B), and NKT cells (C) in the liver of AIM−/− and AIM+/+ mice after C. parvum injection. The numbers of NKT cells in the liver of AIM−/− mice became smaller than AIM+/+ mice from 14 days after C. parvum injection. The absolute cell numbers were calculated on total liver MNCs and the cell subsets obtained from flow cytometric analysis with anti-CD3 and anti-NK1.1 staining. Data are shown as the mean ± SD of three mice. *, P < 0.05.