
Figure 2.
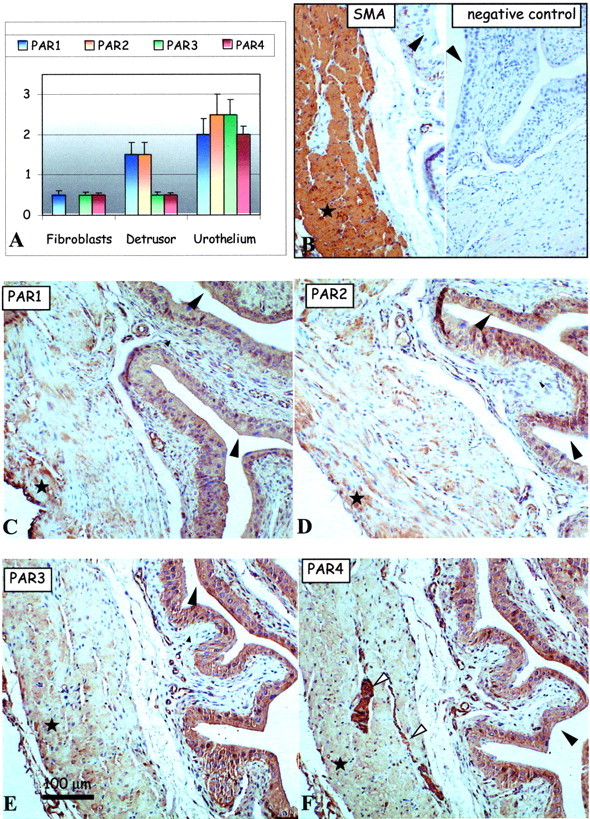
PAR expression in the urinary bladder of saline-treated mice. A: Bar charts show average intensities of immunolabeling for PAR-1 (blue), PAR-2, PAR-3, and PAR-4 in the mouse bladder tissues. B–F: Representative immunohistochemical micrographs show detection of positive control SMA (B, left) and the lack of any immunolabeling using the negative control antibody (B, right) in consecutive sections of mouse bladder tissue. Remaining representative images show immunolabeling patterns for the detection of PAR-1 (C), PAR-2 (D), PAR-3 (E), and PAR-4 (F) expression in serial mouse bladder sections. Large arrowheads identify the urothelium, small arrowheads identify the fibroblasts of the lamina propria in the subepithelial region of the bladder, white arrows identify nerve fibers, and asterisks show areas of the detrusor muscle. Original magnifications, ×150.