
Figure 7.
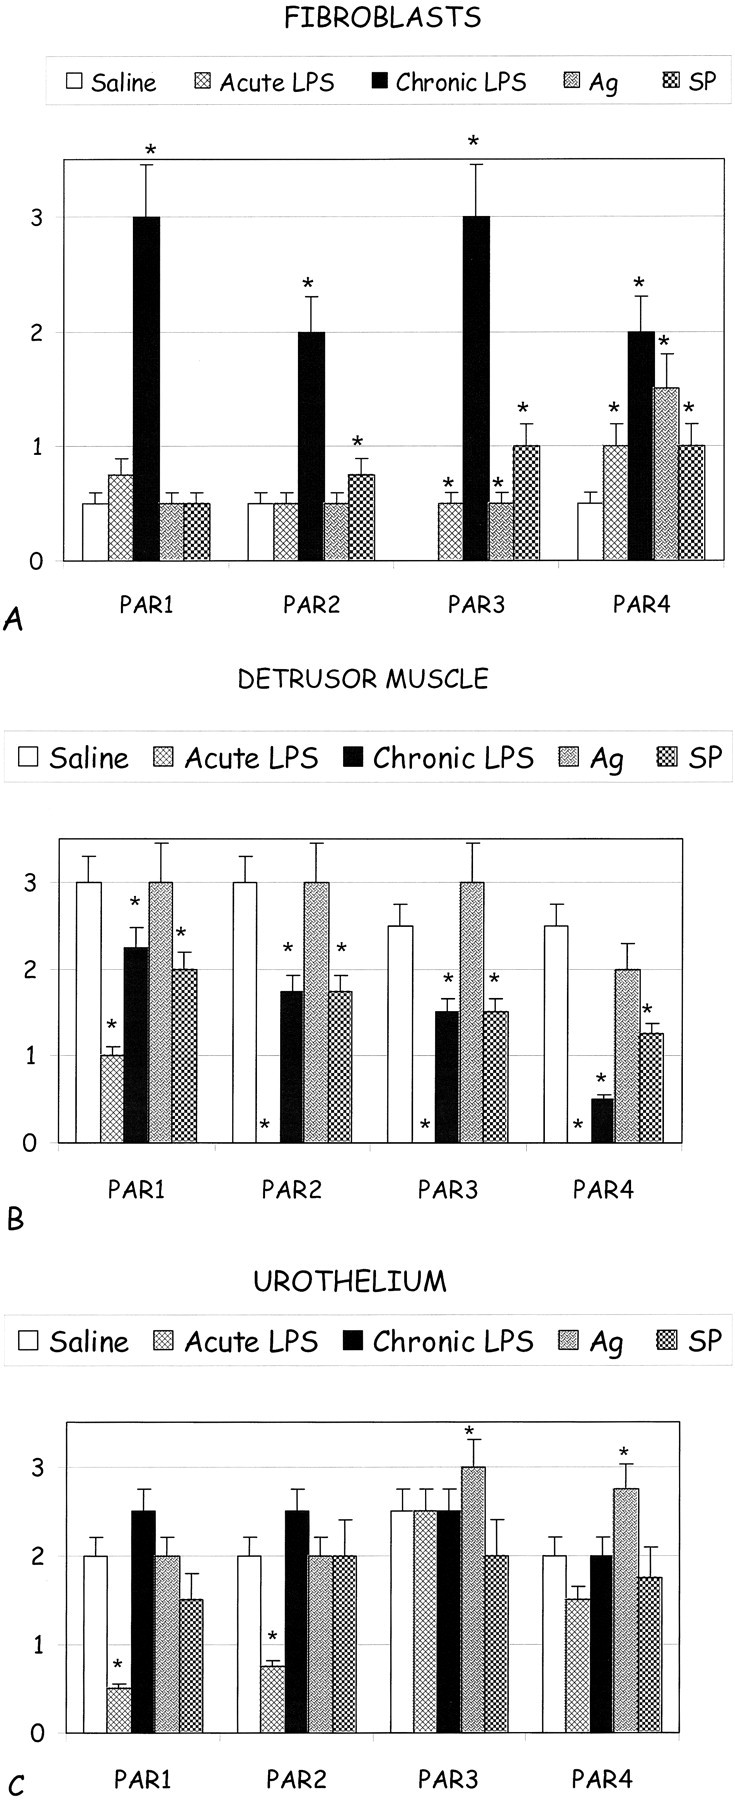
Bar graphs showing comparative PAR-immunolabeling patterns in the various conditions (saline control, acute LPS, chronic LPS, Ag-challenged, SP-challenged) in the fibroblasts of the lamina propria in the subepithelium (A) and in the detrusor muscle (B) and urothelial (C) cells. Asterisks indicate a statistical significant difference (P < 0.05) from bladders treated with saline.