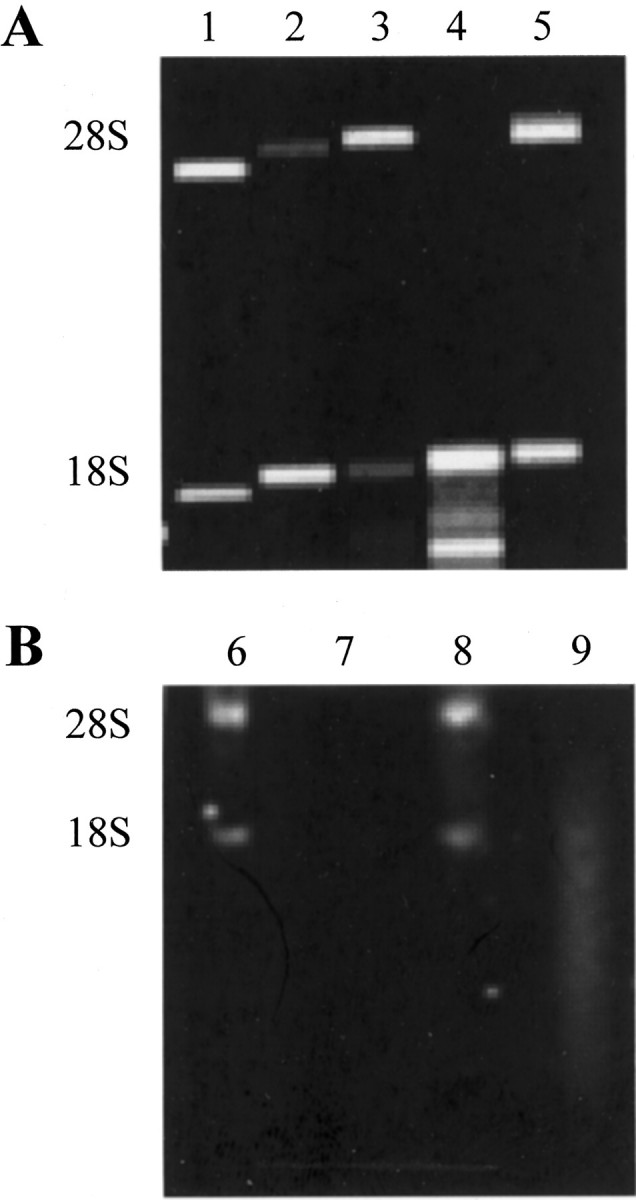
Figure 2.

Qualitative and quantitative assessment of RNA from microdissected tissues. All tissues were fixed in ethanol and embedded in paraffin. Representative examples of Agilent LabChip and mini formaldehyde gel analysis are shown in A and B, respectively. Lanes 1 and 6: High-quality RNA standards (lane 1, 45 ng total RNA; lane 6, 1 ng total RNA). Lanes 3, 5, and 8: High-quality RNA with a 28S/18S rRNA ratio of ∼2 (lane 3, 5.16 ng total RNA; lane 5, 5.46 ng total RNA; lane 8, 1 ng total RNA). Lanes 2, 4, and 9: Semidegraded RNA. Note the 28S/18S rRNA ratio of <2 in lane 2, and the absence of a 28S rRNA band in lanes 4 and 9 (lane 2, 19.26 ng total RNA; lane 4, 14.4 ng total RNA; lane 9, 2 ng total RNA). Lane 7: Completely degraded RNA.
