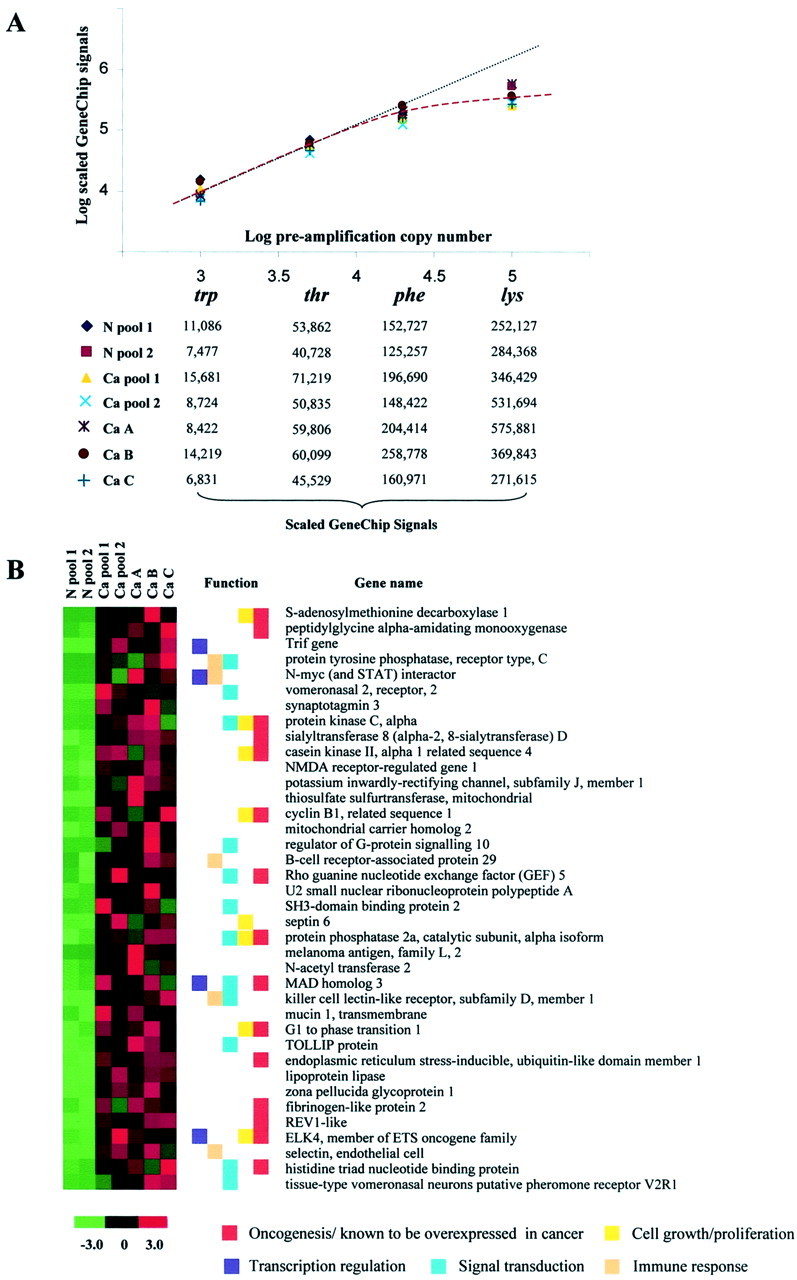
Figure 3.

Hybridization signals of amplification controls and visual representation of the GeneChip signals for 38 transcripts overrepresented in mouse endometrial cancer. A: Logarithmic (log10) plot of the preamplification copy number of B. subtillis transcripts versus the scaled GeneChip signals of these control transcripts in each sample after two rounds of linear amplification, GeneChip hybridization, and signal scaling. The signals for the trp and thr transcripts show a linear correlation (black dotted line), while the scaled signals for the phe and lys messages appear to diverge from the linear plot (red dashed curve). B: A heat map of the 38 annotated transcripts that were overexpressed in all five cancers compared to both normal aRNA specimens that were hybridized to GeneChips. Red indicates an increase in signal intensity and green signifies a decrease in signal levels, both compared to the overall mean signal intensity for each transcript across all GeneChips (black). Colored boxes denote biological function(s) and/or involvement in oncogenesis.
