Figure 3.
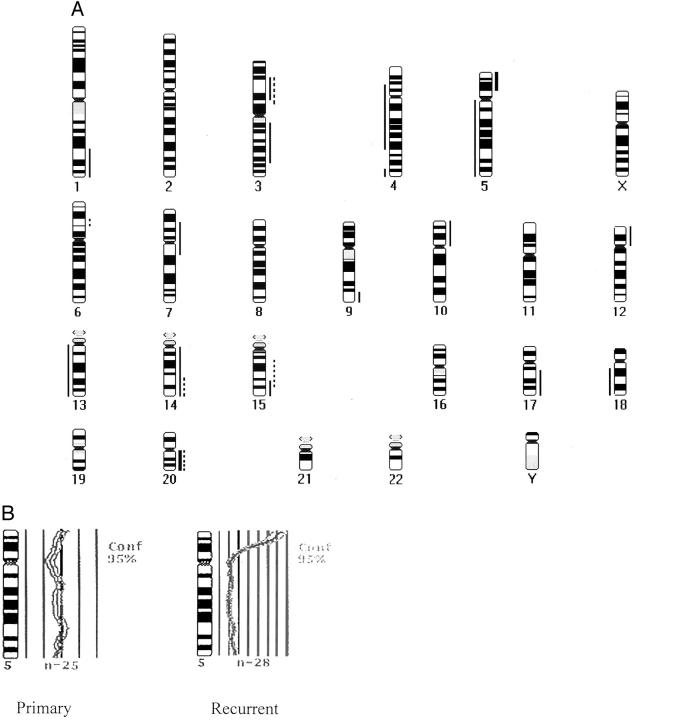
Chromosomal alterations in a medulloepithelioma detected by CGH. A: Thin vertical lines on the right side of the chromosome ideograms indicate gains; thin lines on the left represent losses. High-level gains are depicted as thick lines. Gains and losses in the primary and recurrent tumors from patient 50 are shown, with alterations in the primary lesion represented using dotted lines, and in the recurrent one using solid lines. B: While the primary tumor shows no gains or losses, the recurrent medulloepithelioma has a high level gain at 5p14-pter and loss of 5q. Each line represents a difference ratio of 0.25.

