
Figure 1.
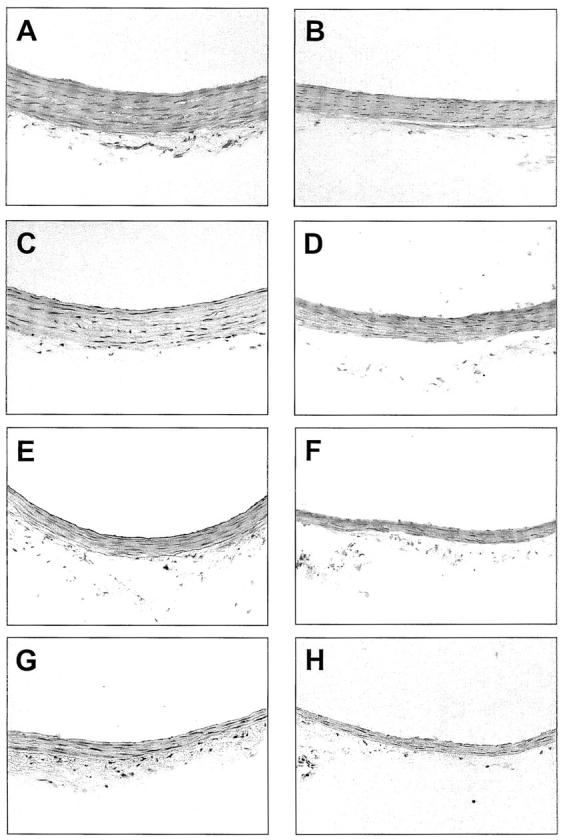
Photomicrographs of representative cross sections of thoracic and abdominal aorta, and mesenteric and renal arteries from a control rat (A, C, E, and G, respectively) and a cirrhotic rat with ascites (B, D, F, and H, respectively). Note the marked reduction in WT and the diminution in the number of nuclei in the cirrhotic vessel (H&E staining; original magnifications, ×200).