
Figure 3.
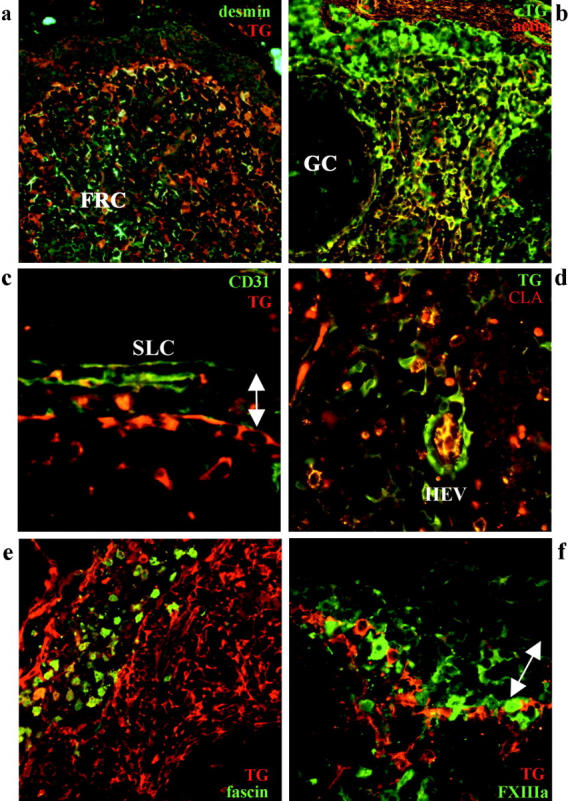
Immunofluorescent analysis of tissue transglutaminase-positive cells in reactive lymph node. a: The FRC network shows strongest TG (red) immunoreactivity in the subcapsular areas with the reverse pattern seen with desmin (green), detected with goat anti-TG/TXR; desmin/Cy2. b: The FRC network shows strong immunoreactivity for both actin (red) and TG (green), generating a yellow signal (detected with mouse anti-TG/Cy2; actin/TXR). c: The inner SLC are positive for TG (red) and negative for CD31 (green), with the reverse pattern seen for the outer SLC (detected with goat anti-TG/TXR; CD31/Cy2). d: Among blood vessels, HEV show the strongest staining for TG (green) with the endothelium also positive for CLA (red), thus appearing as yellow (detected with mouse anti-TG/Cy2; CLA/TXR). e: Dendritic cells and histiocytes in an intranodal sinus are strongly positive for fascin (green) but variably positive for TG (red) (goat anti-TG/TXR; fascin/Cy2). f: Migrating DC of various stages show variable staining for Factor XIIIa but are mostly negative for TG (red) (goat anti-TG/TXR; FXIIIA/Cy2). The arrow indicates the location of subcapsular sinus.