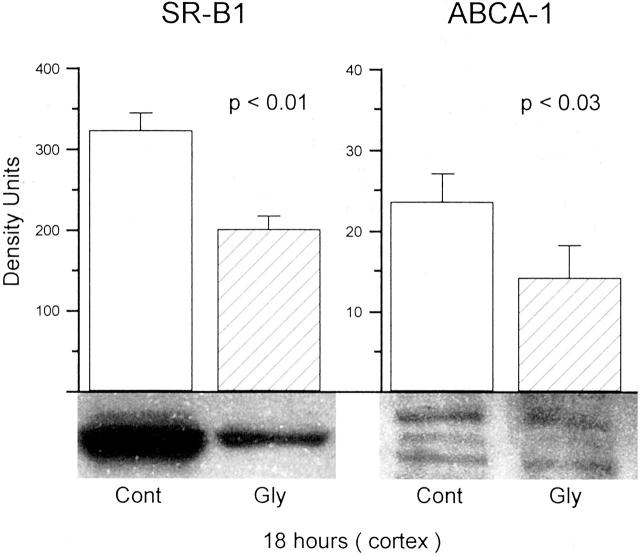
Figure 2.
SR-B1 and ABCA-1 levels in renal cortical samples obtained from control (Cont) mice and from mice 18 hours post-induction of glycerol (Gly)-induced renal failure. As shown in the left panel, there was a marked reduction in SR-B1 in the glycerol-treated mice (n = 6), compared to controls (n = 5). As shown in the right panel, reductions in ABCA-1 bands were also observed (n = 12 for both the control and glycerol-treated group). SR-B1 appeared as a single dense band at 82 kd. In contrast, there was much weaker expression of ABCA-1, assuming a characteristic triplet appearance at ∼220 kd. Each of the three bands were diminished in the glycerol group. (Note the different y axis scales for ABCA-1 and SR-B1, reflecting much lesser apparent expression for the former versus the latter protein.)

