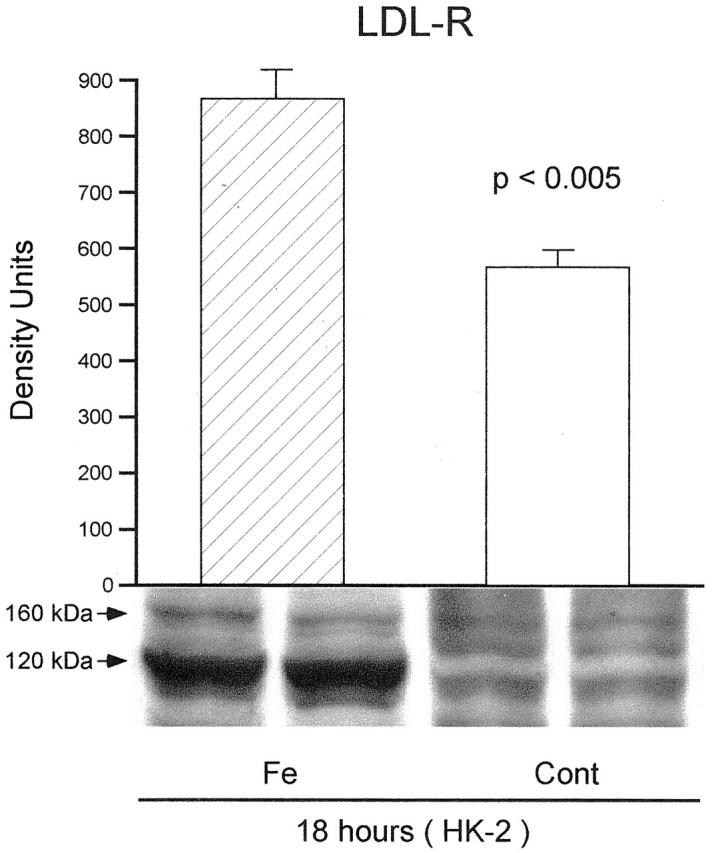
Figure 5.

LDL-R protein expression in HK-2 cells 18 hours following the addition of an Fe challenge. LDL-R appears as a major (nonglycosylated) and a minor (glycosylated) band at 120 and 160 kd, respectively. There was greater expression of the dominant band in the Fe-treated cells versus the control group (P < 0.005; n = 5 per group).
