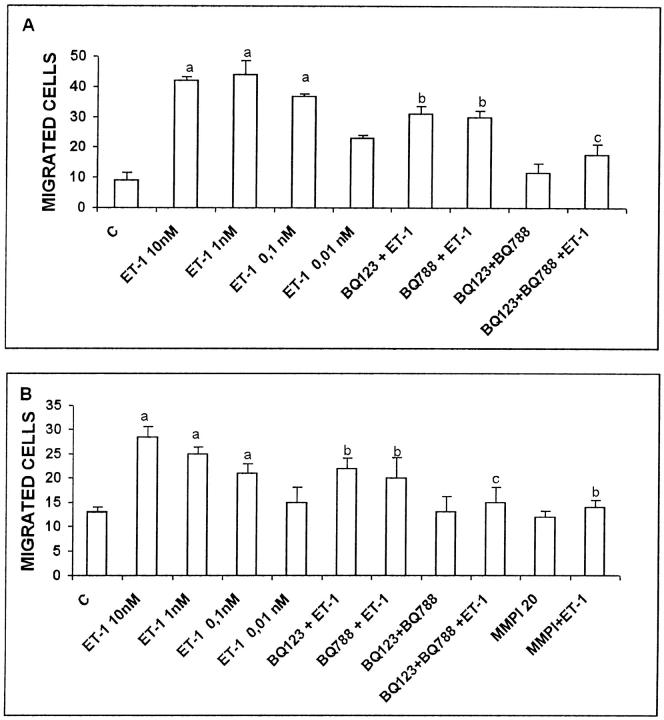
Figure 7.
Effect of ET-1 on KS IMM cell migration and invasion. Columns indicated by a C are controls. KS IMM cells (2.5 × 10⁶ cells/ml) were treated with different doses of ET-1. Cells pretreated with 1 μmol/L of the ETAR antagonist (BQ 123) and/or ETBR antagonist (BQ 788) or with MMP inhibitor (MMPI, 20 μmol/L) were placed in the upper compartment in Boyden chamber in the absence or in the presence of ET-1 (10 nmol/L). Cells migrated through the filter were counted after 4 hours (chemotaxis; A) or cells migrating through the Matrigel layer were counted after 6 hours (chemoinvasion; B). Data are expressed as the number of migrated cells in 10 high-power fields and are means of results from three experiments each performed in triplicate. a, P ≤ 0.001 compared to control. b, P ≤ 0.02 compared to ET-1 10 nmol/L. c, P ≤ 0.001 compared to BQ 123+ET-1 and BQ 788+ET-1.

