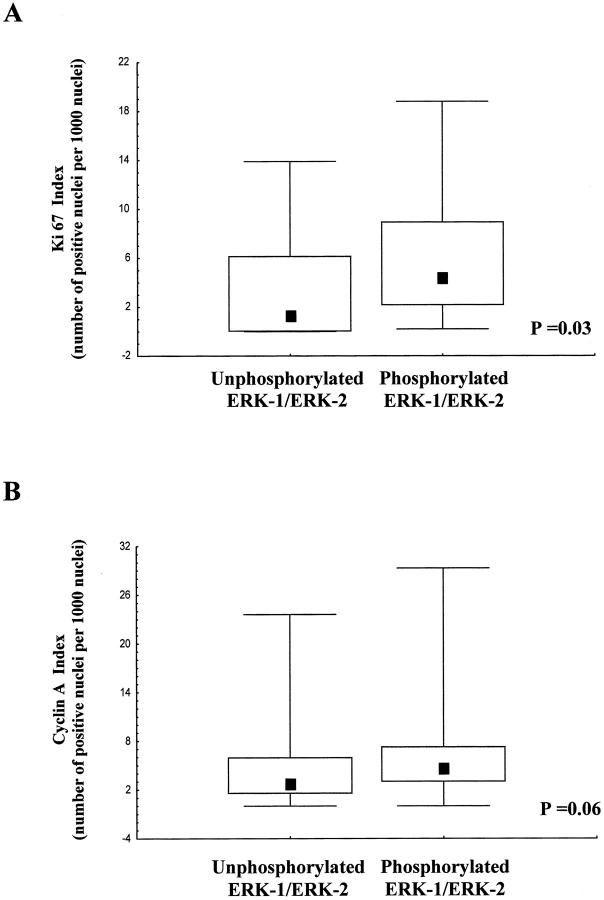
Figure 3.
Box plots of Ki67 (A) and cyclin A (B) index values according to phosphorylated ERK-1/ERK-2 immunoreactivity. Lower and upper limits of boxes indicate the 25th and 75th percentiles; squares within boxes indicate the median values; the lines extending from the boxes indicate the range of non-outlying values. Outliers were not plotted, but included in the statistical analysis.

