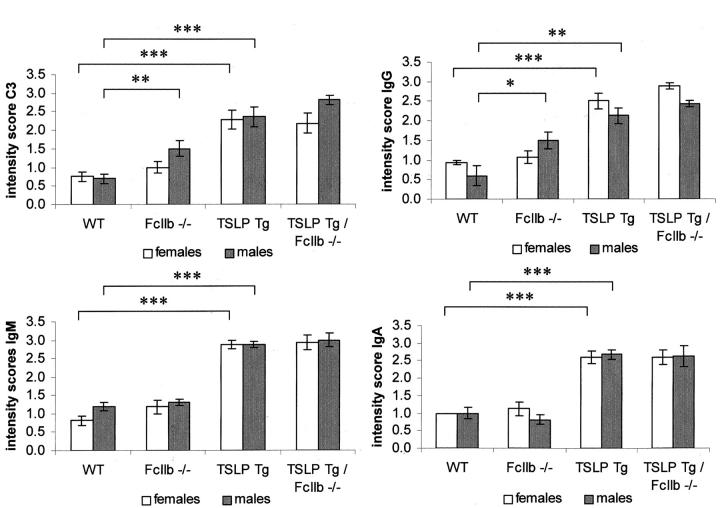
Figure 4.
Glomerular deposition of immunoglobulins and complement. Graphs show semiquantitative assessment of glomerular immunoglobulin deposition and deposition of complement factor C3. Columns show mean ± SEM. Statistically significant differences between experimental groups are expressed as *, P < 0.05; **, P < 0.01; and ***, P < 0.001.

