
Figure 5.
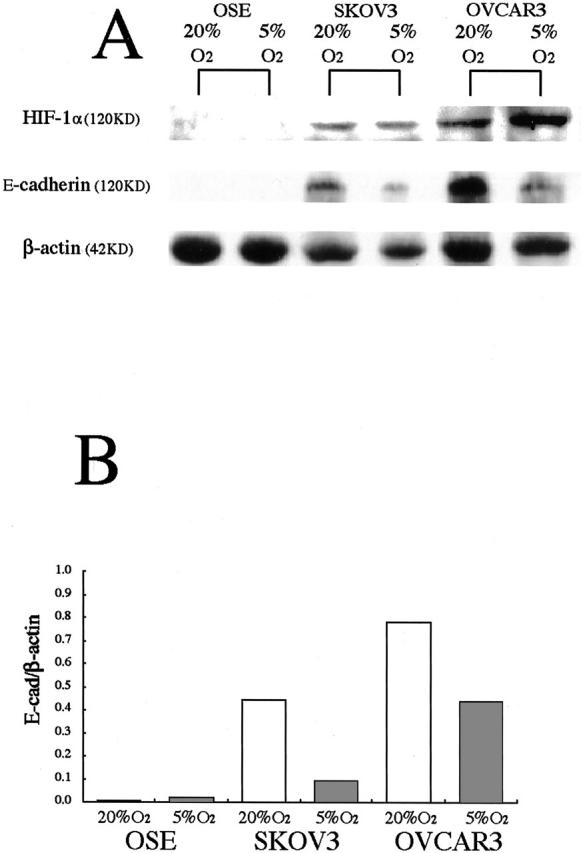
Western blot analysis showing the effect of hypoxia on HIF-1α and E-cadherin proteins in OSE cells and in two ovarian cancer cell lines. A: Specific bands for HIF-1α and E-cadherin were detected, and the band density of HIF-1α is increased in two ovarian cancer cells, but not in OSE cells under hypoxia. E-cadherin expression is remarkably decreased in two ovarian cancer cells, but not in OSE cells under hypoxia. B: The density of the E-cadherin bands was quantified by densitometric analysis. Data are presented after normalization with the β-actin bands.