
Figure 5.
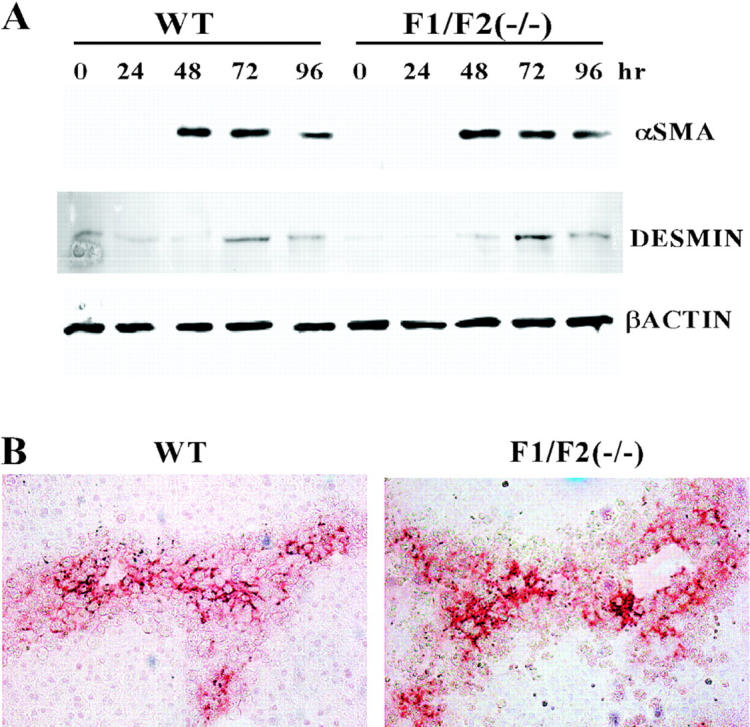
Lack of difference in α-SMA and desmin expression in FGF1(−/−)FGF2(−/−) and WT livers after acute CCl4 treatment. A: α-SMA and desmin expression in liver tissue extracts. Livers from mice of the indicated phenotype at the indicated times after acute CCl4 treatment were excised; the extract from three livers in each treatment group was pooled and analyzed by immunoblot (see Materials and Methods). The displayed autoradiograph is representative of three independent reproductions. B: Immunochemical analysis of activated HSCs expressing α-SMA in tissue sections. Livers at 72 hours after CCl4 treatment were processed and tissue sections prepared as described in Figure 2 ▶ . Original magnifications, ×100.