
Figure 7.
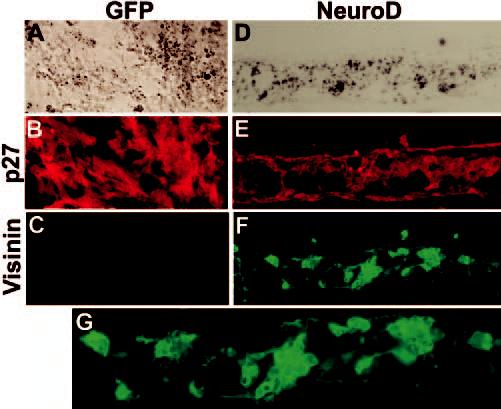
Distribution and expression of visinin in cells injected into the vitreous. Shown are double-staining for p27 (B, E) and visinin (C, F, G) of E17 eyes receiving cells from the control culture (A–C) or transdifferentiating cells (D–G). (G) is a view of (F) at higher magnification. A larger number of cells from RPE cultures infected with RCAS-neuroD were visinin+ (F, G), whereas no visinin+ cells were observed in the control (C). Note the lack of formation of RPE-like tissues among the grafted cells in the vitreous. Original magnifications: (A–F) ×200; (G) ×400.