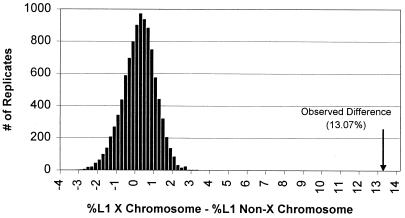
Figure 1.
Nonrandom distribution of L1 elements on the X chromosome. Assuming no chromosomal bias in L1 content, the figure shows a simulated distribution (10,000 replicates) of the difference in the mean L1 percentage between the X chromosome sequence (56.7 Mb randomly assigned) and non-X sequence (the remaining 348 Mb). Under this model variation mostly represents the random sampling of regional differences that occur between sequences. The observed difference (13.07%) between X and non-X sequence did not occur in 1,000,000 replicates (P < 10−6).

