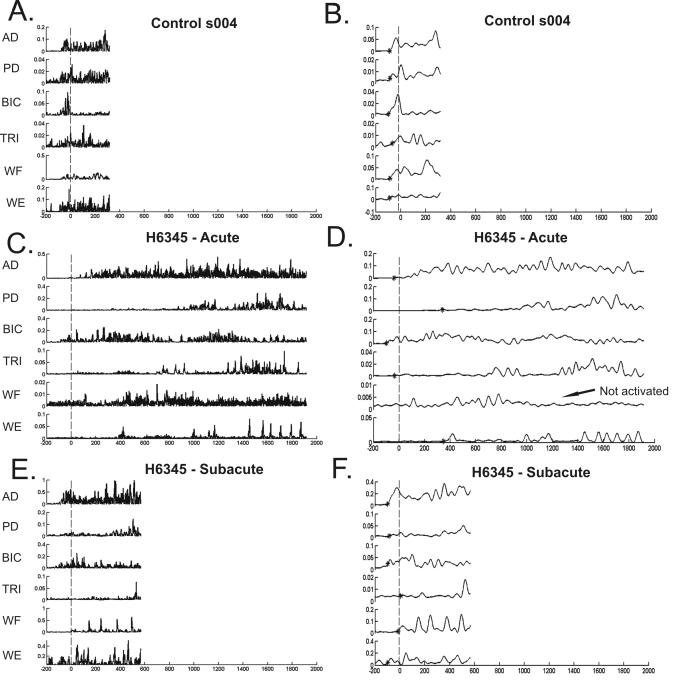
Figure 1.
EMG traces for 6 UE muscles during reaching for a control subject (A, B), and a hemiparetic subject during the acute (C, D) and subacute phase (E, F) after stroke. All EMG traces start 200 ms prior to start of reach and continue to target touch. X axis = milliseconds, with negative numbers representing time prior to start of reach. Y axis = volts. Vertical line indicates the time of start of reach (0 ms). Panels A, C, E show rectified EMG. Panels B, D, F show the EMG envelope (rectified, 20 Hz low pass filter) used in subsequent analyses. * indicates muscle onset. AD = anterior deltoid, PD = posterior deltoid, BIC = biceps, TRI = triceps, WF = wrist flexors, WE = wrist extensors.

