
Figure 2.
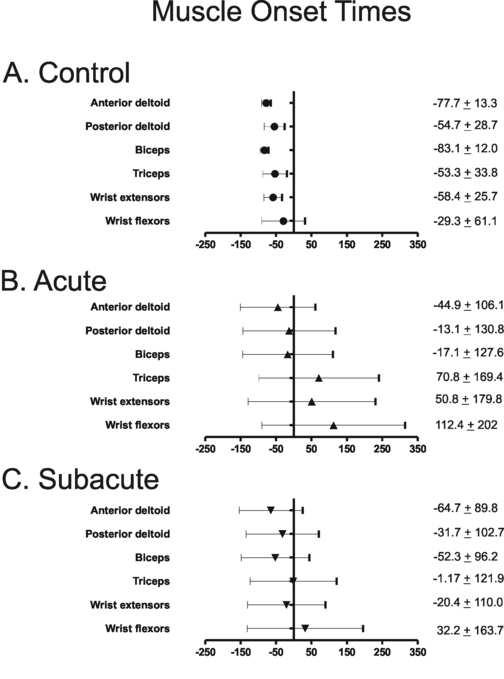
Group mean muscle onset times during reaching for 6 UE muscles for the control group (A.) and the hemiparetic group during the acute (B.) and subacute (C.) phase after stroke. Numeric values are mean (± standard deviation) muscle onset times (ms) for each muscle. Error bars represent standard deviations. X axis = milliseconds, with negative numbers representing time prior to start of reach. Y axis line represents start of reach.