
Fig. 3.
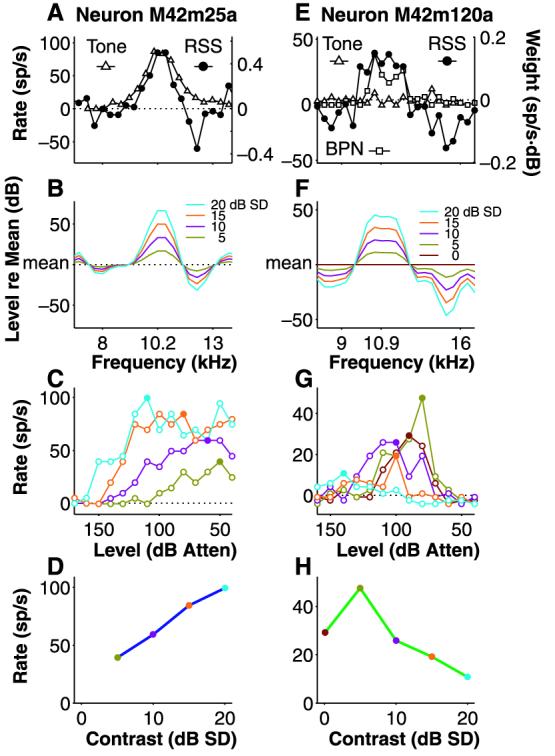
Two opposite responses to spectral contrast. (A) Tuning of the neuron in Fig. 1 to tones (△) as compared with RSS WF (●). (B) The WF was converted into OLS over several spectral contrast values (5 to 20 dB SD). Stimulus spectra were smoothed for illustration only. (C) Rate-level response curves for the four stimuli in (B). Lowest contrast elicited least response; highest contrast, greatest. Threshold shifts commonly occur as contrast is varied. (D) The peak rates from the rate-level curves in (C) (filled symbols) are plotted against stimulus contrast to produce a monotonic rate-contrast curve. (E) Tuning of another neuron to tones (△), 0.4-octave BPN (□), and RSS WF (●). (F) Smoothed spectra of OLS at contrast values of 0 to 20 dB SD. (G) Rate-level curves showing decreased responsiveness at the highest contrasts. (H) Rate-contrast curve revealing nonmono-tonic characteristics.