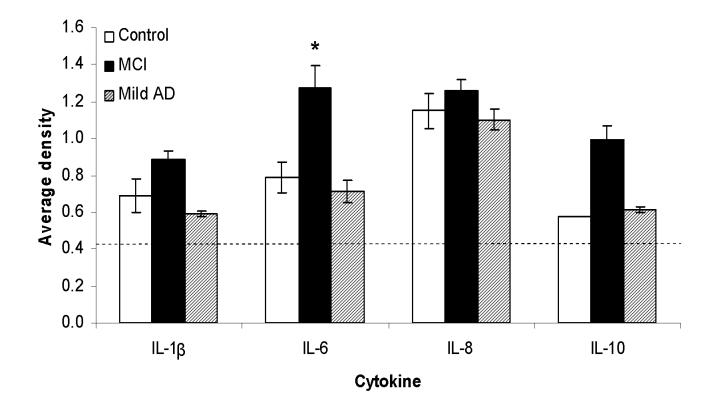
Figure 2.
Densitometric quantification of cytokine levels from the cytokine arrays in elderly controls (n=6), MCI (n=4), and mild AD subjects (n=3). To compare results between different membranes, the signals (average density) for each cytokine were normalized to the positive controls on each membrane. Two out of three mild AD cases had detectable levels of IL-10 expression, but only one out of seven control cases showed IL-10 expression. All MCI subjects showed detectable of IL-1β, IL-6, IL-8, and IL-10. Dashed lines indicate the detection limit (0.53), *p < 0.03, significantly different from controls.

