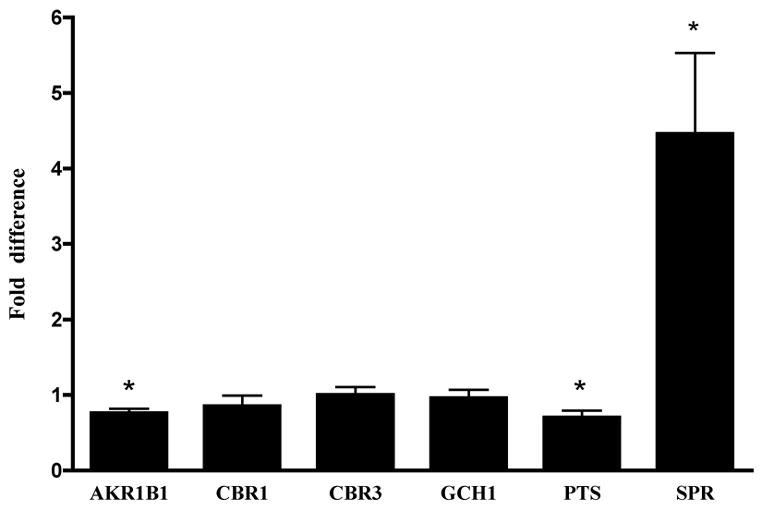
Figure 1.

Real-time RT-PCR expression of BH4 enzymes in PD brain. Genes are listed along the x-axis. Bars represent the mean fold difference ± SEM for the PD cases compared to controls. Asterisks (*) indicate significant differences in gene expression between PD cases and controls according to a Student’s t-test with p<0.05.
