
Figure 5.
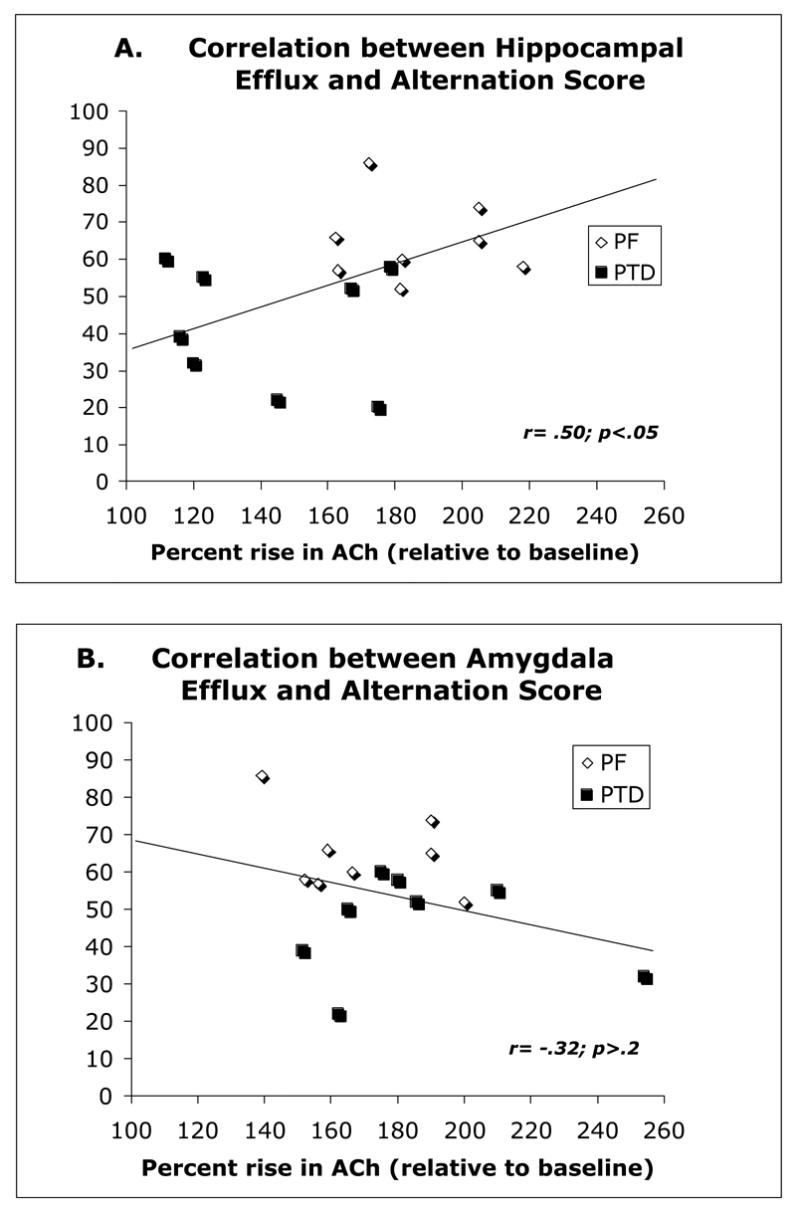
Correlative relationship between spontaneous alternation rate and ACh efflux in the hippocampus (top) and amygdala (bottom). Trend lines on each graph represents the overall combined regression analysis for the PTD and PF groups.
Official websites use .gov
A
.gov website belongs to an official
government organization in the United States.
Secure .gov websites use HTTPS
A lock (
) or https:// means you've safely
connected to the .gov website. Share sensitive
information only on official, secure websites.
Correlative relationship between spontaneous alternation rate and ACh efflux in the hippocampus (top) and amygdala (bottom). Trend lines on each graph represents the overall combined regression analysis for the PTD and PF groups.