
Fig. 2.
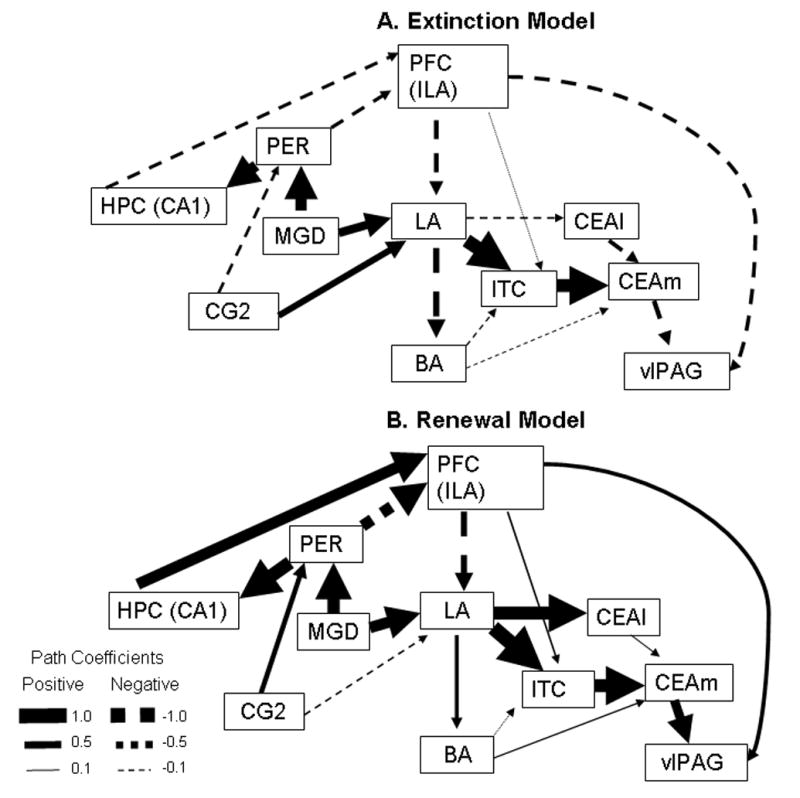
Graphic representation of the direct effects for the a) fear extinction model and b) fear renewal model. Magnitude of the direct effect is proportional to arrow width for each path. Positive path coefficients are shown as solid arrows, whereas negative coefficients are shown as segmented arrows. Values for width gradient are given in the legend at the bottom left of the figure.