
Figure 2.
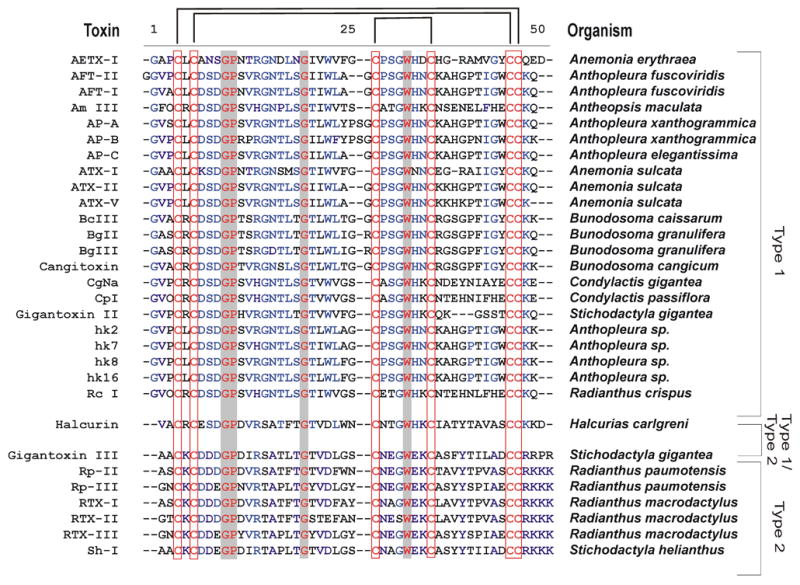
Sequence alignment of Type 1 and Type 2 sea anemone toxins. The conserved cysteine spacing and bonding pattern is indicated by red squares and black bars above the sequence. Conserved residues over all sequences are indicated in red text with grey background. Highly conserved residues per Type are indicated in blue. Hydroxylated proline residues are indicated with the letter O. References for the toxins can be found throughout the text.