
Figure 4.
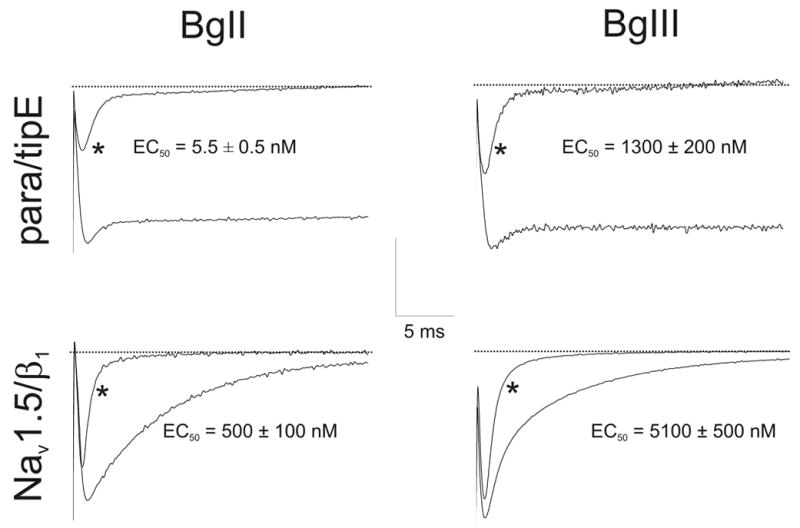
Effects of sea anemone toxins on Nav channels. The left column represents the effects of BgII, right column the effects of BgIII on the cloned Nav channels expressed in Xenopus laevis oocytes. * represents control conditions where no toxin was added. Traces shown are before, and after, addition of: Para/BgII (20 nM); Para/BgIII (5 μM); Nav1.5/BgII (1 μM); Nav1.5/BgIII (60 μM). Current traces were evoked by depolarisations ranging from −20 to 10 mV depending on the Nav channel, from a holding potential of −90 mV. Scale bar: y-axis scale for para/tipE is 0.5 μA; Nav1.5/β1 is 1 μA. EC50 values are shown on the figure.