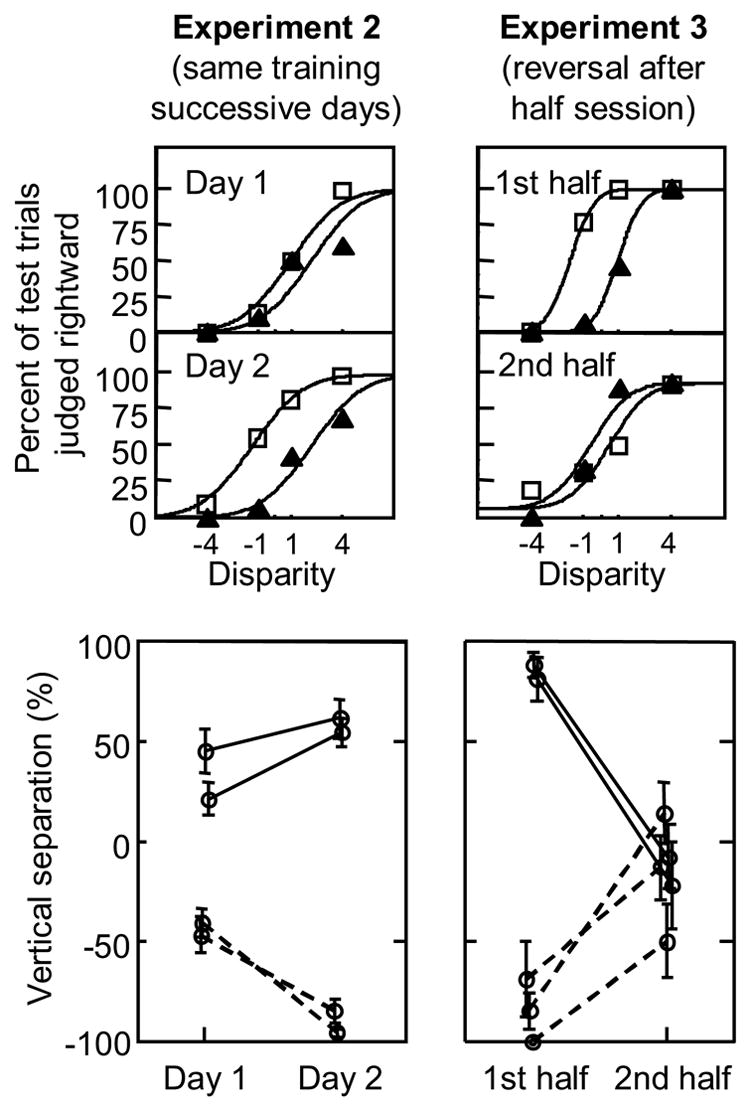
Fig. 3.

Results from Experiments 2 and 3, showing that the new POSN cue had a long lasting effect. Top panels show data from a single trainee in each experiment, respectively, in the format of Figure 2, for Days 1 and 2 (Experiment 2, left) or for the first and second half of the session (Experiment 3, right). The bottom panels plot vertical separation between the two fitted psychometric functions for all trainees in each experiment, respectively. Initial training in each experiment was counterbalanced across trainees (half positive correlation, solid lines; half negative, dashed lines). In Experiment 2, all trainees showed additional reliance on POSN in the second session as compared to the first (p < .01 for 3 of the 4 trainees, normal test using estimated standard errors). In Experiment 3 the correlation between POSN and long-trusted cues was reversed half way through the experiment. The first 20% of each half session is excluded from the analysis. All trainees unlearned the initial correlation to some extent during the second half of the session, and some trainees achieved reversal, but no trainee learned the reversed correlation as strongly as the initial correlation. Thus, learning from the first half lasted longer than just a few trials. Error bars are the standard deviation of 2000 bootstrap estimates (Efron & Tibshirani, 1993) of the vertical separation of the two curves, fitted using the same procedure as with the original data in Experiment 1. Small horizontal offsets in bottom panels are to make the data easier to see.
