
Figure 5. Effector functions are differentially regulated during Treg induction.
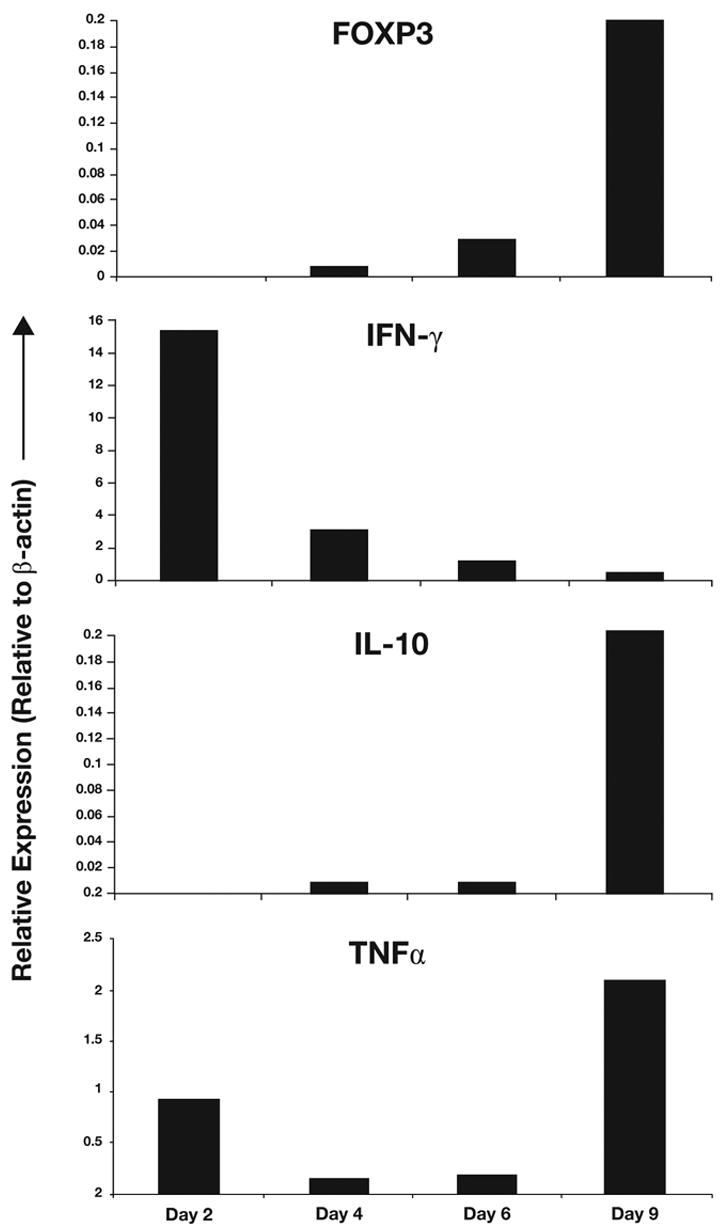
Allostimulated CD4+CD25− T-cell cultures were flow sorted for CD4+, CFSEhigh, CD25+ fraction (Day 2), CD4+, CFSElow, CD25+, dividing fraction (Days 4, 6 and 9) to obtain highly pure induced Treg populations at different stages of their formation. FOXP3, IFN-γ, TNF-α and IL-10 messages were quantified by real time PCR and normalized to β-actin. Presence of specific product was confirmed by dissociation curve and gel analysis.