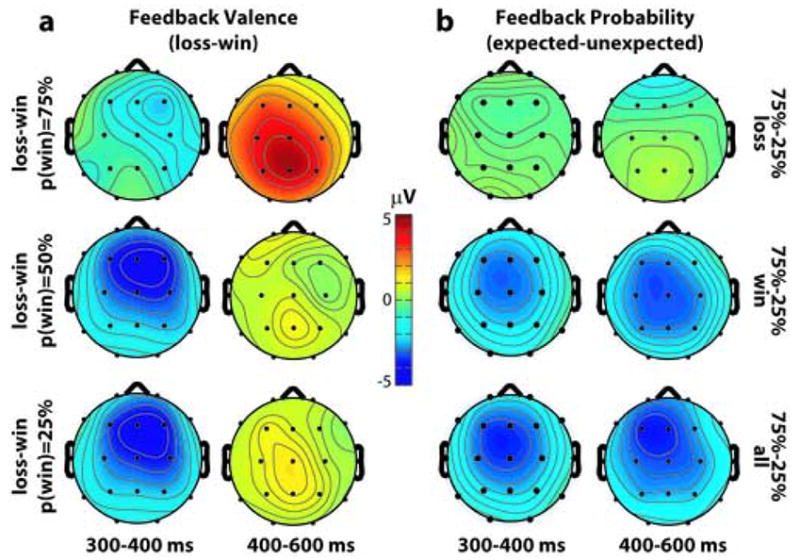
Figure 3.

Topographical distribution maps taken from a 300–400 ms post-feedback window. (a), maps of the feedback valence effect (loss - win) as a function of reward probability during the 300–400 ms window (left column) and 400–600 ms window (right column). (b), the probability effect (75% vs. 25% probability of reward) as following losses (top), wins (middle), and losses and wins averaged together (bottom). Topographic differences for 75%–25% are displayed, but all probability differences (e.g., 75%–50%) for wins have nearly identical topographic distributions.
