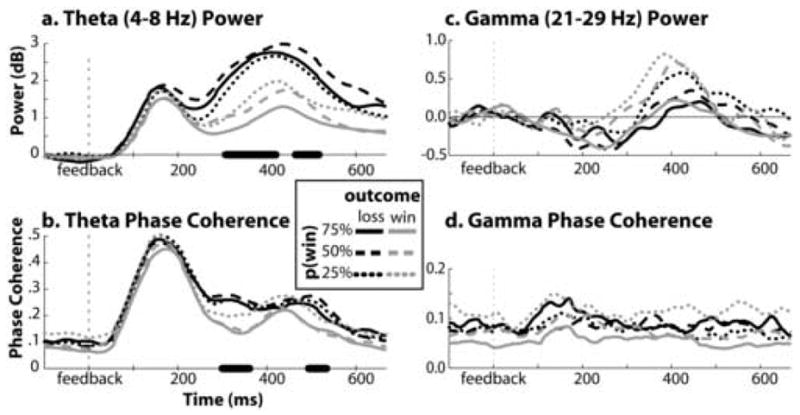
Figure 7.

Time course of power (top panel) and phase coherence (bottom) in theta (left) and gamma (right) frequency bands, plotted separately for combinations of feedback valence and probability. A paired-sample t-test between values for losses and wins (averaging over probability condition) at each time point was run, and values that were significant at p<.01 have bolded x-axes. Full ANOVAs of these differences are reported in the text. Data are taken from electrode Fz.
