
Fig. 3.
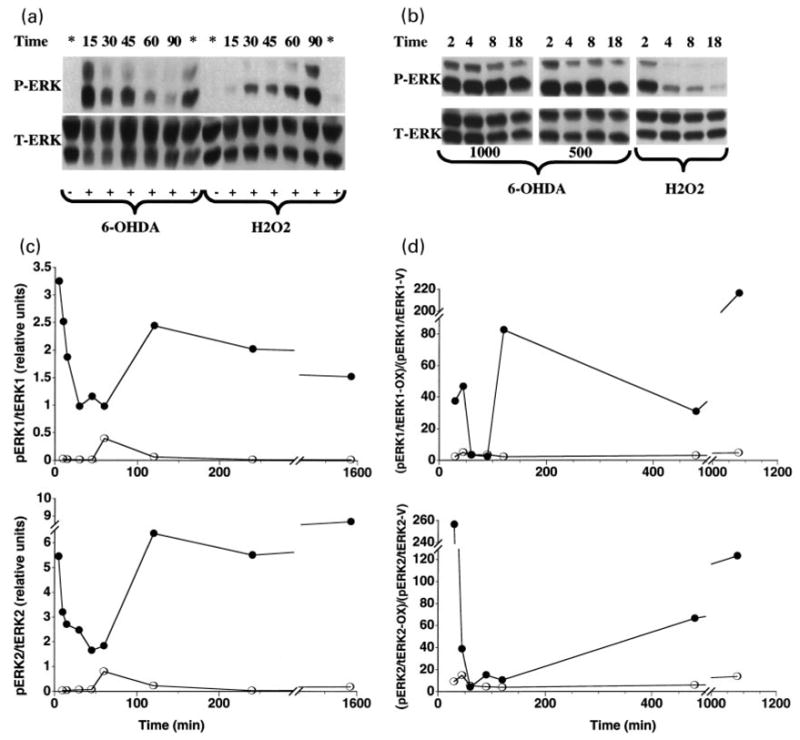
Kinetics of ERK activation in B65 cells in response to 6-OHDA and H2O2. (a) Cells treated with 500 μM 6-hydroxydopamine (6-OHDA) or 1 mM H2O2 (H2O2) for the indicated times (minutes) were lysed and equal amounts of protein (50 μg) were subjected to immunoblot analysis using antibody against the activated form of ERK (top, P-ERK). The blots were then stripped and reprobed with antibody against total ERK (bottom, T-ERK). Lanes designated with * were harvested following an overnight (16 h) incubation. Lanes designated with – were treated with the appropriate vehicle (0.05% ascorbate for 6-OHDA, water for H2O2). (b) Cells were treated with either 1000 or 500 μM 6-OHDA or 1 mM H2O2 for the indicated time (hours) then subjected to immunoblot analysis as in (a). (c) Immunoblots from cells treated with 1000 mM 6-OHDA were subjected to densitometric analysis, and the data for the ERK1 (top panel) and ERK2 (bottom panel) isoforms from a representative time-course is shown. Closed circles (●) represent the relative band intensity of phosphorylated ERK/total ERK elicited by 6-OHDA; open circles (○) represent the phosphorylated ERK/total ERK ratio observed in vehicle-treated cells. Cells treated with only fresh DH10 exhibited a pattern of ERK phosphorylation similar to that seen with the vehicle controls. (d) Immunoblots from cells treated with 500 μM 6-OHDA and 1 mM H2O2 were subjected to densitometric analysis, and the data for the ERK1 (top panel) and ERK2 (bottom panel) isoforms from a representative time-course is shown. Closed circles represent the relative band intensity elicited by 6-OHDA while open circles represent the relative band intensity elicited by H2O2. Data are expressed as the ratio of phosphorylated ERK to total ERK elicited by the oxidizing agents (pERK/tERK-OX) normalized to the ratio of phosphorylated ERK to total ERK elicited in vehicle treated cells (pERK/tERK-V). Data shown in panels A–D are representative compilations of 10 independent time-course experiments.