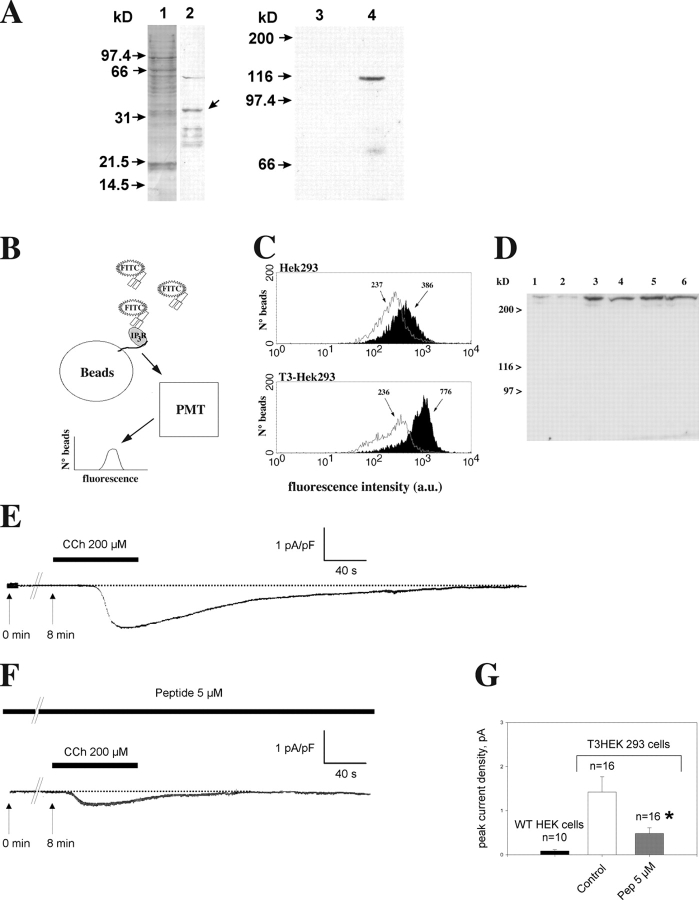
Figure 7.
A peptide encompassing the cytoplasmic domain of junctate complexes with the InsP3R via TRPC3 and inhibits TRPC3 current induced by carbachol in HEK293 cells stably expressing TRPC3. (A) Microsomal membrane fraction from T3-HEK293. Lane 1, Ponceau red staining; lane 2, antijunctate Ab immunostaining. Arrow indicates the band corresponding to junctate. The microsomal proteins of T3-HEK293 were solubilized, pulled down with Streptavidine beads coated either with a biotinylated peptide corresponding to the NH2 terminus of junctate (lane 4) or a biotinylated peptide corresponding to the scrambled sequence of the NH2- terminal domain of junctate (lane 3), and stained with anti–HA-tag Ab (lanes 3 and 4, respectively). (B) Model depicting the experimental approach used in C. (C) Peptide pull-down reactions analyzed by flow cytometry. Beads used in the pull down were coated with either an irrelevant peptide (gray lines, unshaded histograms) or junctate-derived peptide (shaded histograms). After incubation with cell lysates, beads were stained with goat anti-InsP3R type 3, followed by anti–goat IgG-FITC (x axis, log scale of geometric mean fluorescence intensity; y axis, number of events counted) and analyzed by flow cytometry. The geometric mean fluorescence intensity readout values are noted above each peak. (D) Immunoreactivity of total lysates prepared from HEK293 cells (lanes 1, 3, and 5) and T3-HEK293 cells (lanes 2, 4, and 6). Total lysates from 5 × 10⁴ (lanes 1 and 2), 105 (lanes 3 and 4), and 1.5 × 10⁵ cells (lanes 5 and 6) were stained with anti-InsP3R type 3 Ab. (E–G) Cells were clamped at −40 mV and stimulated for 40 s with 200 μM carbachol (CCh, black bar) 8 min after establishment of the whole cell configuration (t = 0 min). Recordings of TRPC3 currents in control cells (E) and peptide dialyzed cells (F). Histogram (G) showing mean ± SD of control and peptide-treated current densities of seven different sets of experiments performed with wild-type HEK293 and T3-HEK293 cells. *P < 0.02.

