
Fig. 4.
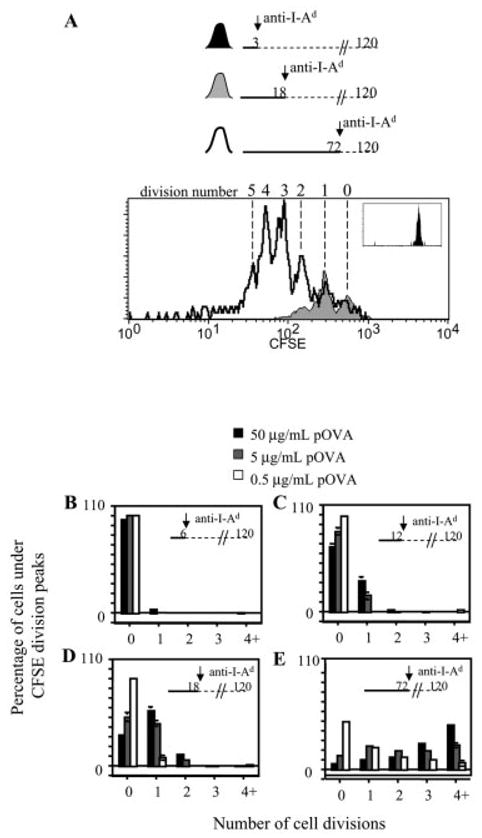
Duration of antigenic stimulation by macrophage APC committing naive CD4+ T cells to cell division. (A) CFSE-labeled DO11.10/RAG2−/− T cells were stimulated by pOVA (50 μg/ml)-loaded macrophages for the periods indicated in the timelines, but cultured for 120 h. FCM analysis showed that proliferating T cells had diluted their CFSE dye and could be scored as to the number of mitoses they had undergone, indicated by the cell division number above the histograms. The undivided peak (division number ‘0’) was identified by the high CFSE label of unstimulated cells (not shown), which was equivalent to that of T cells stimulated for only 3 h (black shaded histogram, inset). (B–E) These graphs summarize the cell division profiles of T cells from the experiment in (A) for three dilutions of pOVA, and for various durations of stimulation. Each bar graph represents the percentage of cells under the specified CFSE division peak.