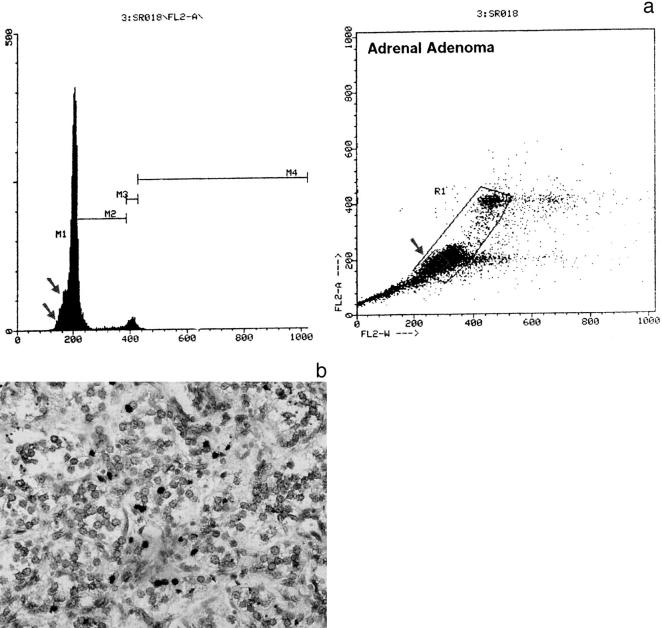
Figure 2.
a: Flow cytometric analysis of DNA content in adrenal cortical adenoma (ACA-18). Right: the small square (arrow) in the analysis nuclear area (horizontal FL2- RW axis) versus DNA content (vertical FL2-A axis) points to the apoptotic cells. b: ISEL of DNA fragments in adrenal cortical adenoma (ACA-18). The apoptotic cells in a determine the pre-G0/G1 slope (two arrows) in the DNA histogram (a, left side) and were found positive by using ISEL (b, black nuclei).

