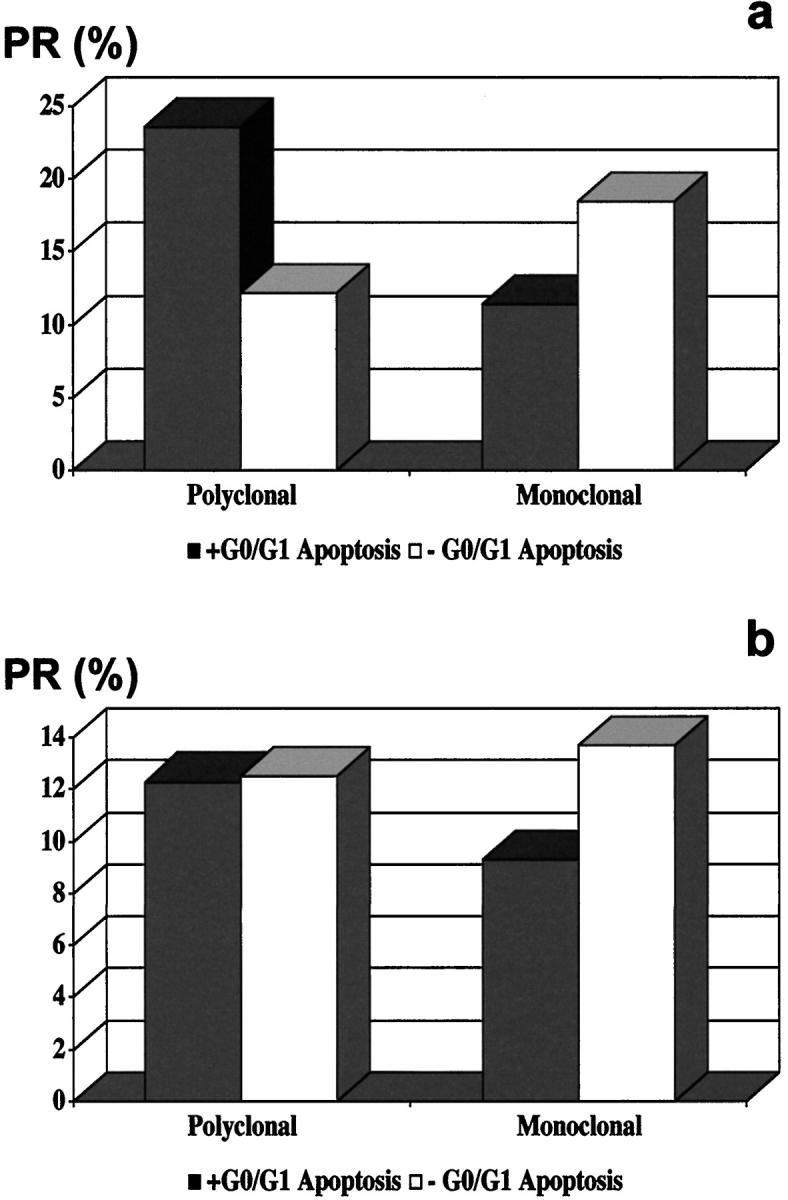
Figure 4.

PR in ACNHs (a) and ACAs (b) in the presence (□) or absence (▪) of G0/G1 apoptotic cells. The average PR was significantly higher in polyclonal ACNHs with G0/G1 apoptotic cells, monoclonal ACNHs with no G0/G1 apoptotic cells, and monoclonal ACAs with no G0/G1 apoptotic cells than in their counterparts.
