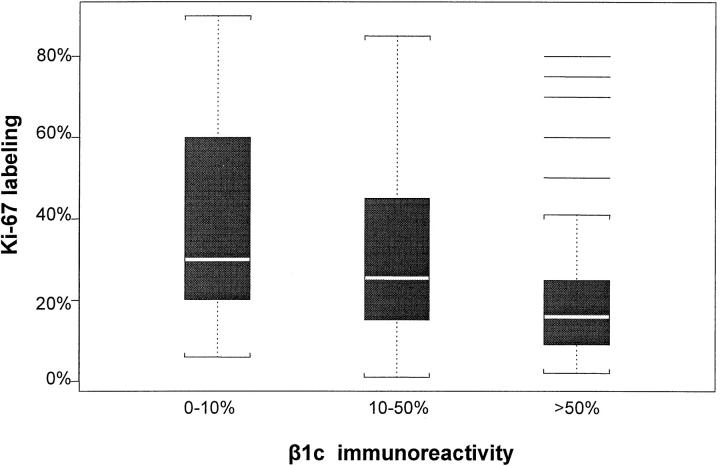
Figure 5.
Box plots for the association between Ki-67 and β1C immunoreactivities. The boxes represent the interquartile range (data from the 25th to the 75th percentile); the horizontal lines in the middle of the boxes represent the median or 50th percentile of the data. The dotted lines emerging from the boxes extend to 1.5-fold the interquartile range (whiskers). The horizontal lines at the top of the box for β1C immunoreactivity higher than 50% represent outliers (data points falling outside the whiskers).

