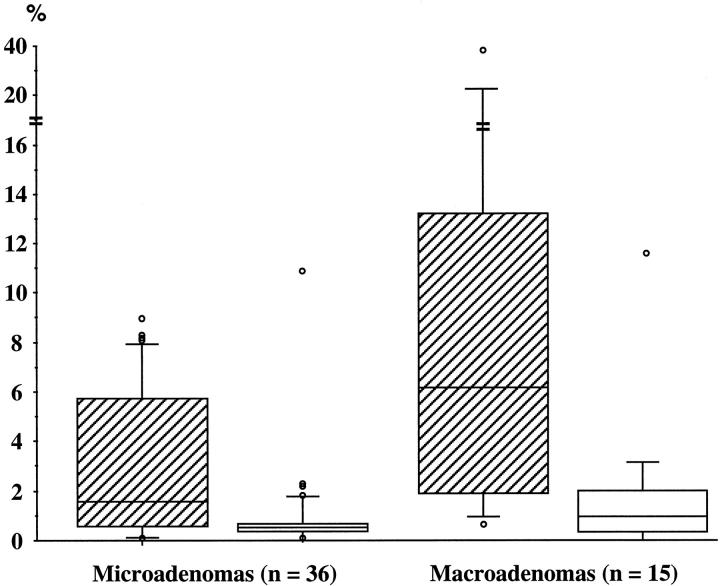
Figure 2.
Box graphs and whisker plots representing the distribution of Ki-67 LI (hatched boxes) and apoptotic index (open boxes) in 51 patients with histology-proven Cushing’s disease grouped into micro- and macroadenomas according to maximum tumor diameter. The box contains values between the upper and lower quartiles and shows the interquartile range (IQR). The line cutting the box is the median. The lines or whiskers extend from the ends of the box to either the largest values that are within the range upper quartile +1.5 × IQR or to the smallest values within the range lower quartile −1.5 × IQR. More extreme values are shown as individual points. Because of the skewed distribution, the data were logarithmically transformed before statistical analysis. The difference of Ki-67 LI between the two groups was significant by Student’s t-test for unpaired data (t = 3.38; P < 0.002), whereas no significant difference of apoptotic index was detected (t = 1.45, P > 0.10).

