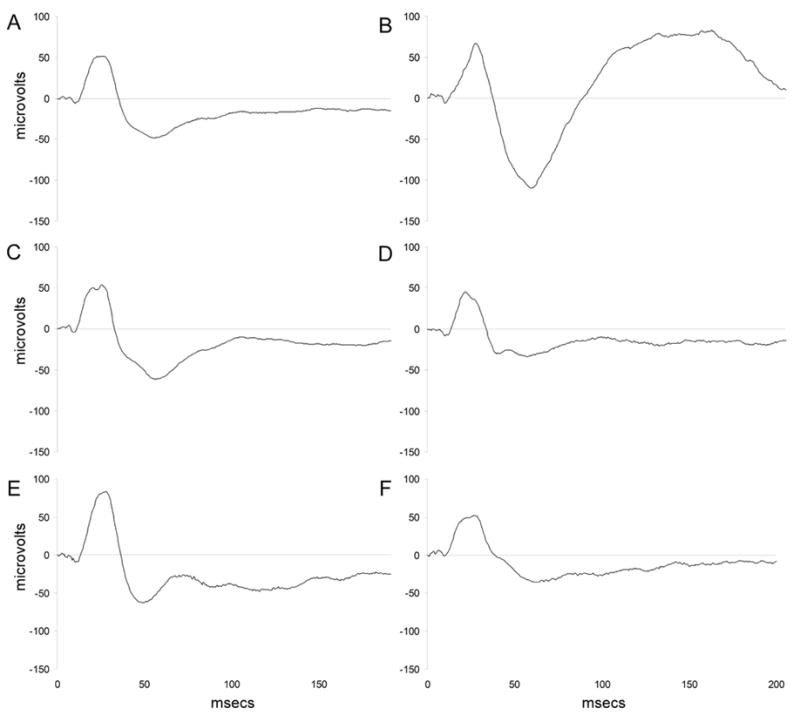
Figure 1.

Grand average event related potential tracings and average ERPs for each drug condition. (A) Grand average ERP tracing. (B) ERP tracing from a single, saline-treated mouse. (C) Average ERP trace for mice following administration of saline. (D) Average ERP trace for mice following administration of 2 mg/kg mecamylamine. (E) Average ERP trace for mice following administration of 1 mg/kg nicotine. (F) Average ERP trace for mice following administration of 2 mg/kg mecamylamine followed by 1 mg/kg nicotine. ERP amplitude in microvolts is shown on the ordinate and time in milliseconds in displayed on the abscissa.
