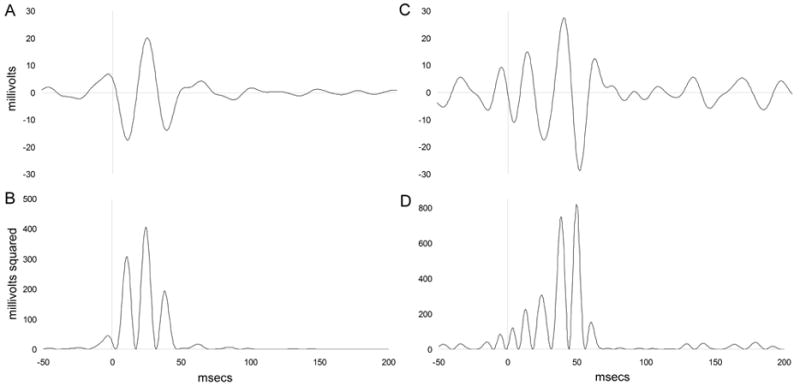
Figure 2.

Grand average gamma oscillation tracings and gamma tracings from a single saline treated mouse. An 85 dB white noise stimulus was presented at 0 ms. (A) Grand average gamma filtered data; data were digitally band pass filtered between 31–61 Hz with 3dB cutoff points of 26.6 and 65.8 Hz and artifact rejected for movement. Inset depicts raw EEG data from a single mouse. (B) Grand average rectified gamma data; gamma data were rectified by squaring to produce a positive value for gamma activity at each point and enable measurement of the area under the curve (AUC). (C) Gamma filtered data from an individual mouse in the saline condition; data were digitally band pass filtered between 31–61 Hz with 3dB cutoff points of 26.6 and 65.8 Hz and artifact rejected for movement. (D) Rectified gamma data from a single mouse in the saline condition; gamma data were rectified by squaring to produce a positive value for gamma activity at each point and enable measurement of the area under the curve (AUC). The evoked window (0 – 70 ms) contains the normal, time-delimited burst of evoked gamma following a stimulus.
