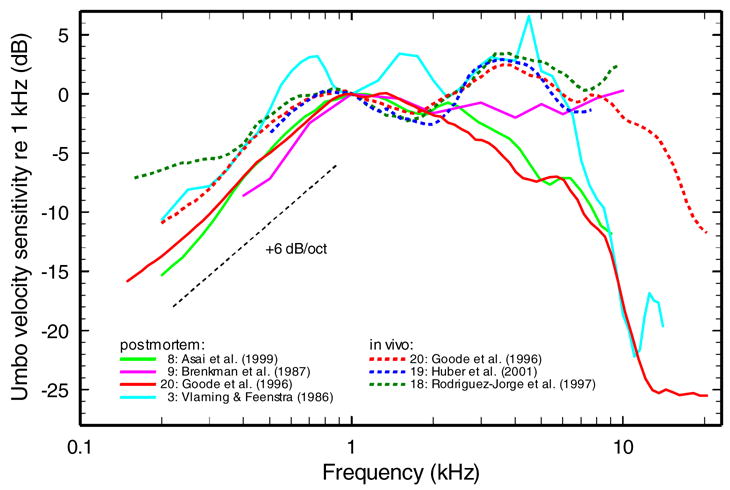
Fig. 2.

The frequency dependence of umbo vibration velocity in humans, in vivo and postmortem. The magnitudes of umbo velocity were normalized to 1 kHz and plotted as a function of frequency using a decibel scale. The in vivo data (dashed lines) from 18 were computed from their Fig. 6, according to the equation, [(χ + SD) – (χ − SD)]/2, where χ = mean, SD = standard deviation of the mean. Other in vivo data were taken from 19, Fig. 5, and 20, Fig. 4c. The postmortem curve from Fig. 4c of 20 represents data from 3 other studies by the same group: 5,10,21. The postmortem curve from 3 represents medians computed from 4 individual measurements given in their Fig. 2. Other postmortem data (solid lines) were taken from: 8, Fig. 5 and 9, Fig. 7. (Those reading a black-and-white version of the paper should refer to the color version of this figure in the online archival version.)
