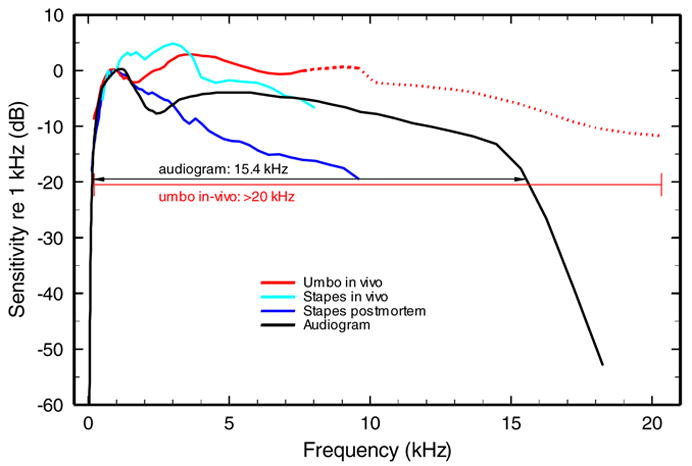
Fig. 3.

A comparison between the human behavioral audiogram and the magnitudes of vibration velocity of the stapes and umbo, in vivo and postmortem. Black line: human behavioral audiogram from 25. Red line: in vivo umbo data of Fig. 2: the solid segment indicates medians computed from three studies (Fig. 2); the thick-dash line segment represents two studies; the dotted line represents one study. Light blue line: the in vivo stapes data of Fig. 1 2. Dark blue line: group medians for the postmortem stapes data of Fig. 1. (Those reading a black-and-white version of the paper should refer to the color version of this figure in the online archival version.)
