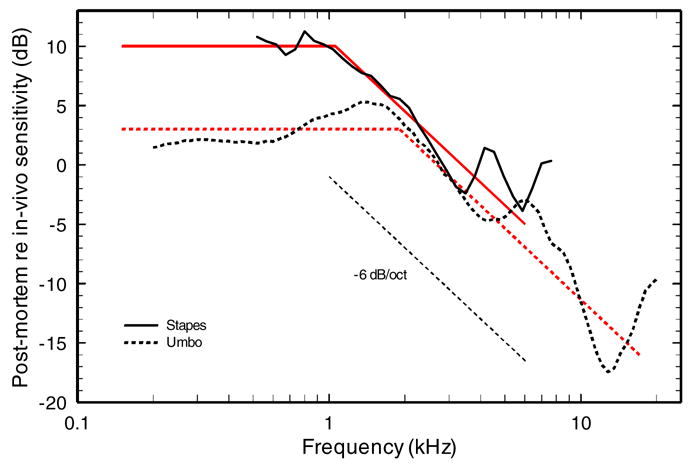
Fig. 4.

Relative magnitudes of postmortem and in vivo vibrations of the stapes and umbo. The magnitudes of postmortem vibration velocity are expressed in decibels relative to in vivo velocity. The relative magnitudes of umbo and stapes velocity are indicated by the solid and dashed lines, respectively. The umbo data are from 20; the stapes data are from 2,8. The red lines represent low-pass filters with corner frequency between 1 and 2 kHz and high-frequency slopes of −6dB/octave. (Those reading a black-and-white version of the paper should refer to the color version of this figure in the online archival version.)
